Trends and Statistics - Drug and Alcohol
Addiction Statistics

As an addiction treatment center in Orange County, The Edge Treatment Center grapples with addiction daily. Learn more about addiction trends of 2021.
The Edge Treatment Center Keeps a Careful Eye on Addiction Statistics. Learn More About Addiction Trends Below:
As an addiction treatment center in Orange County, The Edge Treatment Center grapples with addiction daily. Addiction is a widespread issue that affects more people than you think. Watch this sobering video from our Medical Director Dr. David I. Deyhimy, MD, FASAM, to get a true idea of the human impact of addiction.
Key takeaways include:
22 million people suffer from active substance use disorders
23 million people are in addiction recovery
45 million people are directly impacted by addiction
1 in 3 households suffers from, is exposed to, or is otherwise impacted by addiction
Does America Have a Drinking Problem?
Learn more about our troubled relationship with alcohol and drinking.
Public Perception of Substance Use Disorders:
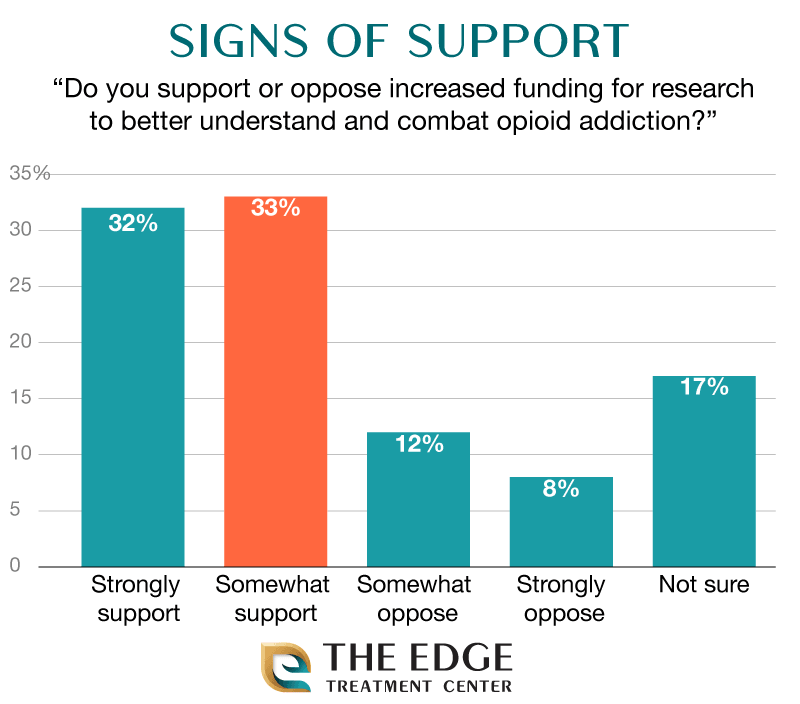
Public Support for Increased Opioid Addiction Research Funding
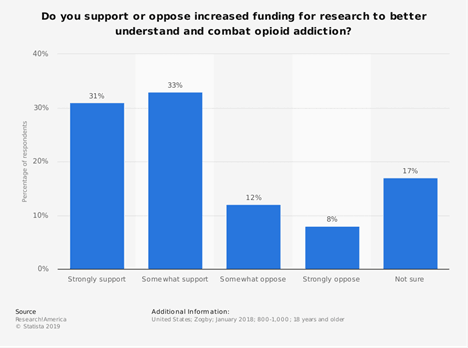
A majority of people support funding for research into combating opioid addiction.
Who Patients Hold Responsible for the Opioid Crisis
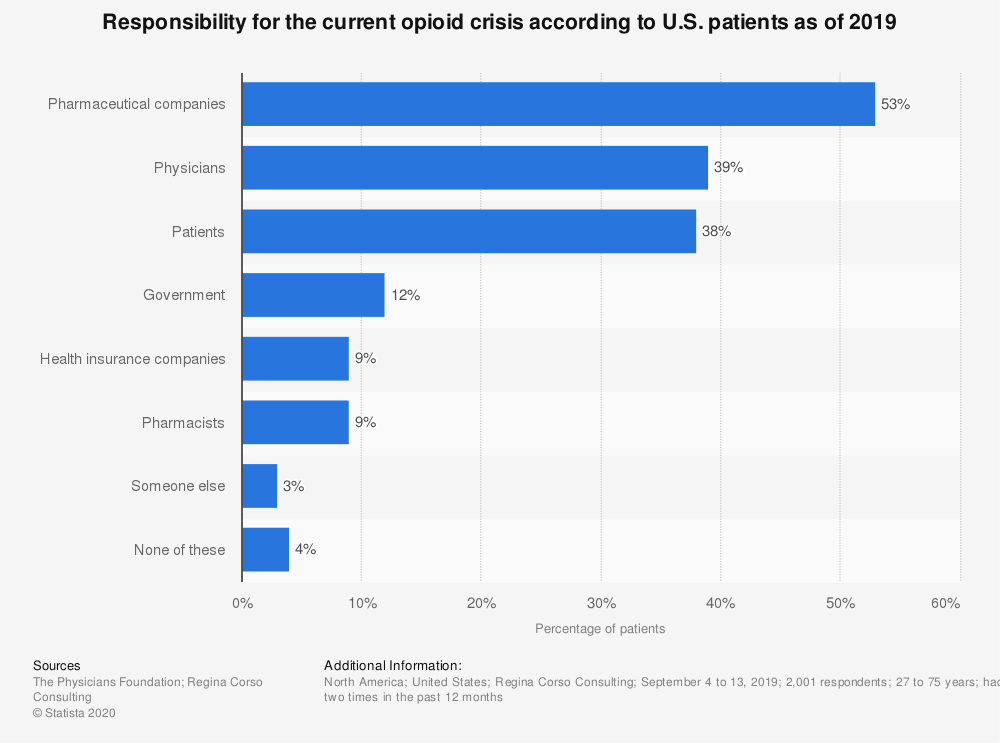
A majority of Americans hold prescription companies responsible for the ongoing opioid crisis.
Percentage of Adults Who Felt Substance Use Was a Community Problem
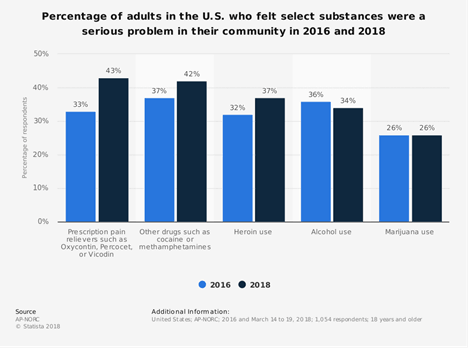
An increasing number of adults view prescription painkillers and illicit drugs like cocaine or methamphetamines as serious community issues.
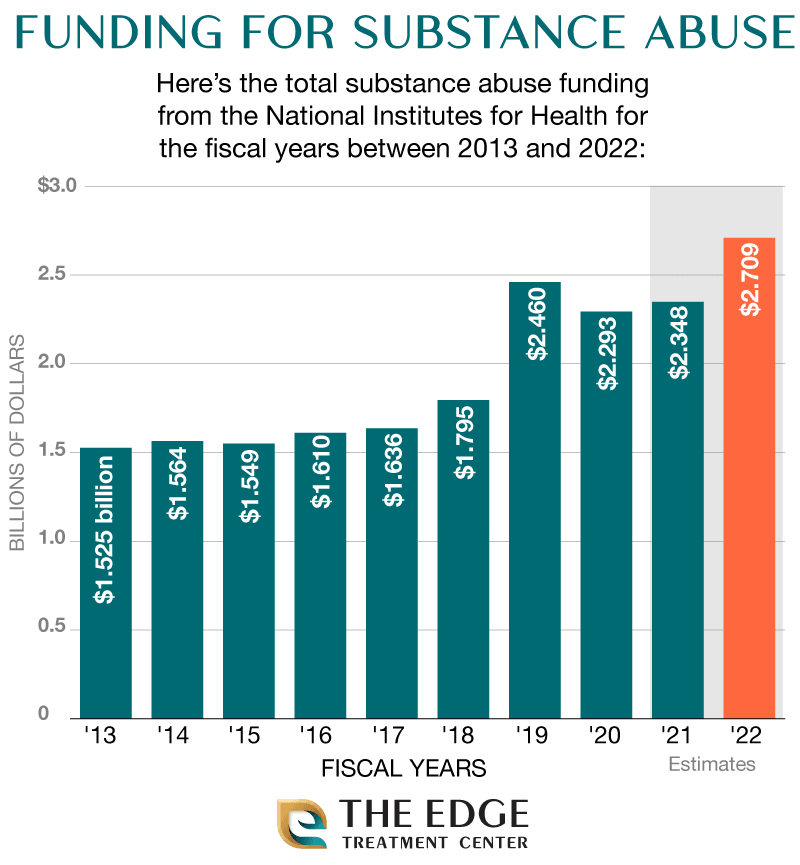
Funding for Substance Use Disorders by National Institutes for Health (NIH)
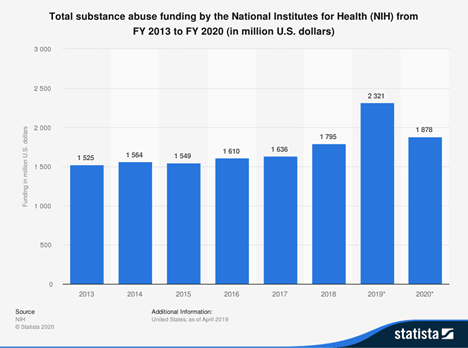
Substance abuse funding by the National Institute for Health (NIH) has increased every year in the past 7 years with the exception of 2020.
Percentage of Adults Who Know Someone Who Misuses Opioids
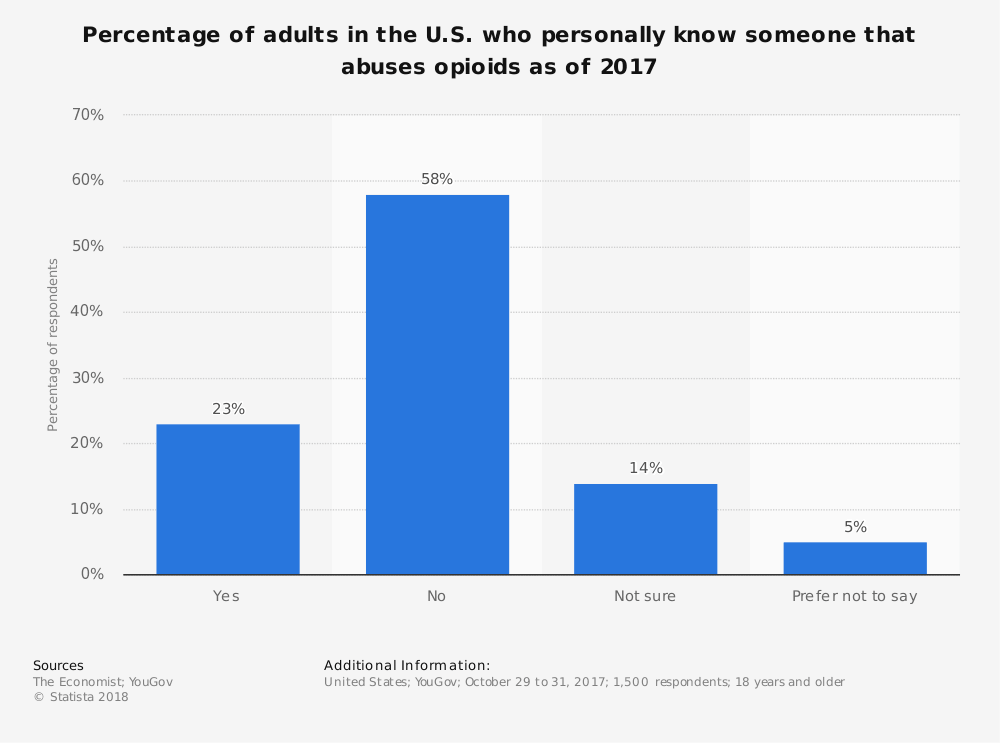
Nearly 1/4 of adults know someone who misuses opioids/has opioid use disorder.
Perceived Barriers to Combating the Opioid Epidemic
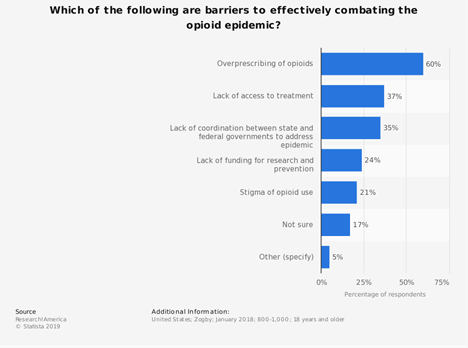
A majority of Americans feel that overprescription of opioids is the main barrier to effectively combating the opioid epidemic.

We’re Here To Help You Find Your Way
Would you like more information about addiction statistics? Reach out today.
Economic Addiction Statistics:
Costs of Tobacco, Alcohol, Illicit Drugs, and Prescription Opioids in The Billions
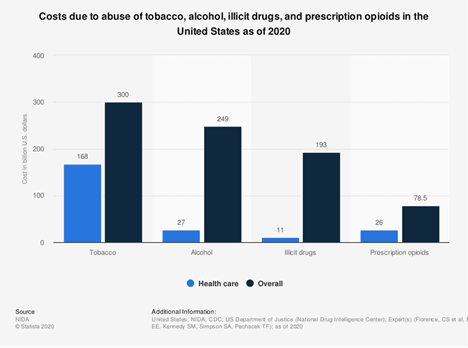
In the United States, the costs to healthcare and to society overall for tobacco, alcohol, illicit drugs, and prescription opioids topped over 193 billion for “illicit drugs”, 78 billion for prescription opioids, 250 billion for alcohol, and 300 billion for tobacco use.
The Economic Burden of the Opioid Epidemic, By The Numbers
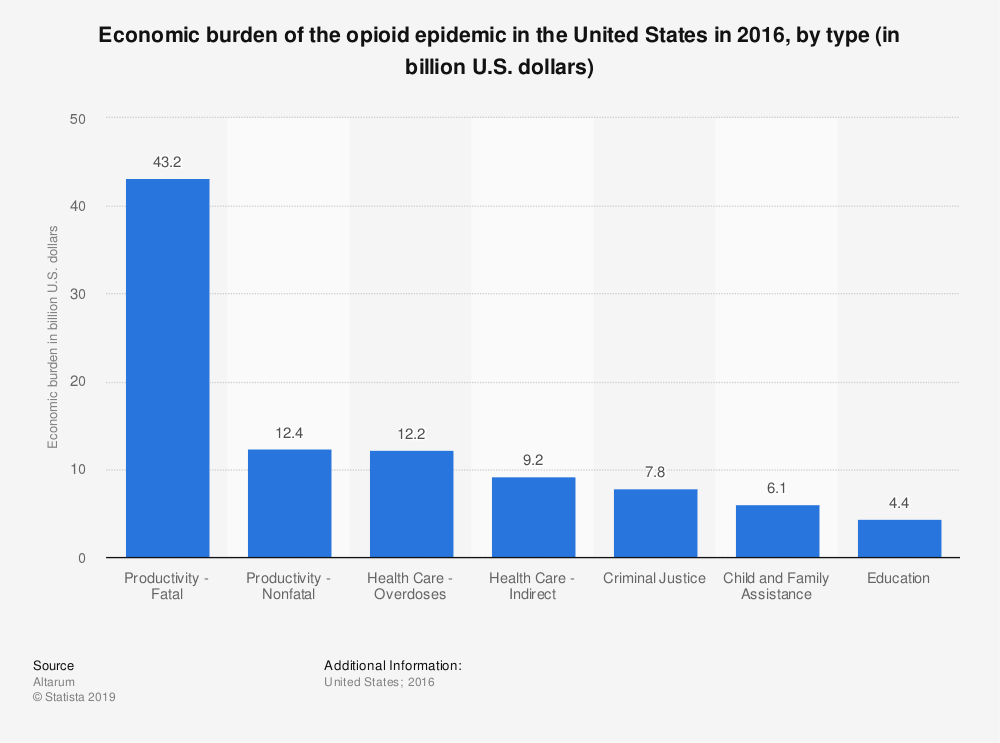
Deaths represent the greatest financial costs of the opioid crisis. Addiction treatment and other health care costs are a fraction of the cost of loss of life.
Economic Losses of Opioid Overdoses, Incarceration, and Loss in Productivity
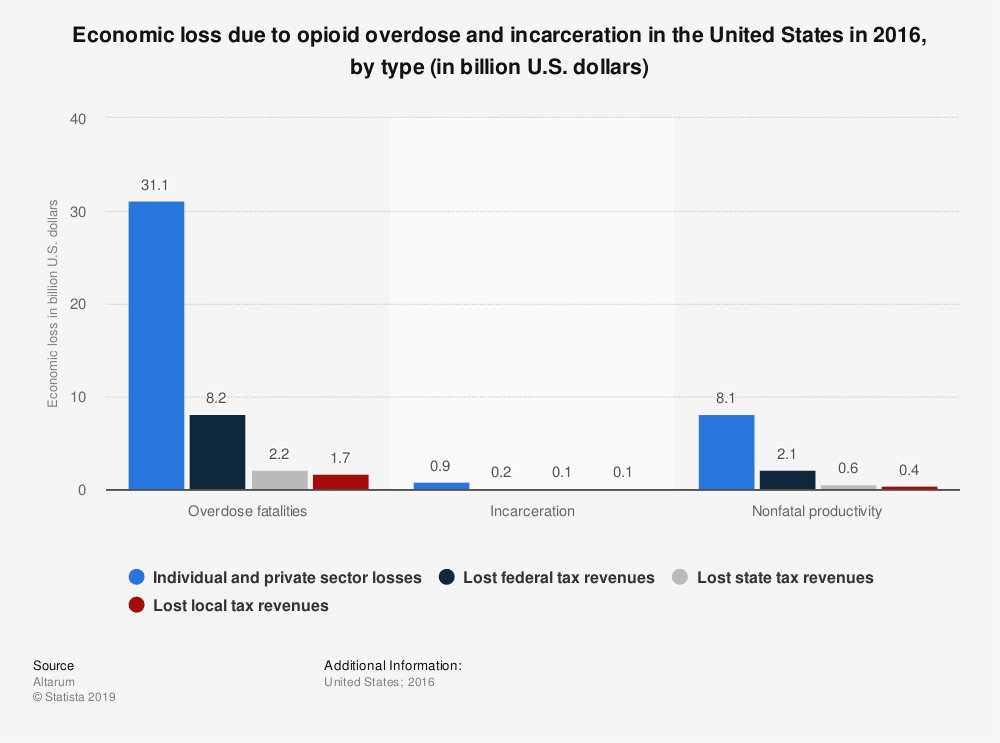
The greatest cost of the overdose crisis is fatalities, and this impacts individuals and private sectors more than it impacts the federal, state, or local tax bases.
Geographic Addiction Statistics
International Addiction Statistics
Global Estimated Drug Deaths
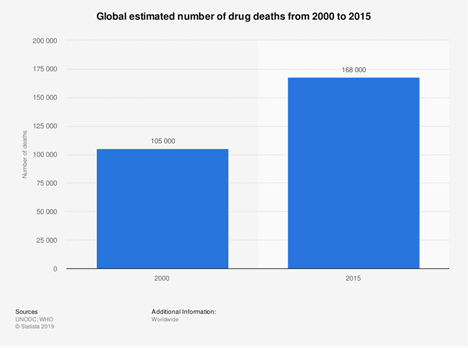
The estimated increase in international drug-related deaths is over 60,000 from 2000 to 2015
Drug Induced Deaths per Million, by Country
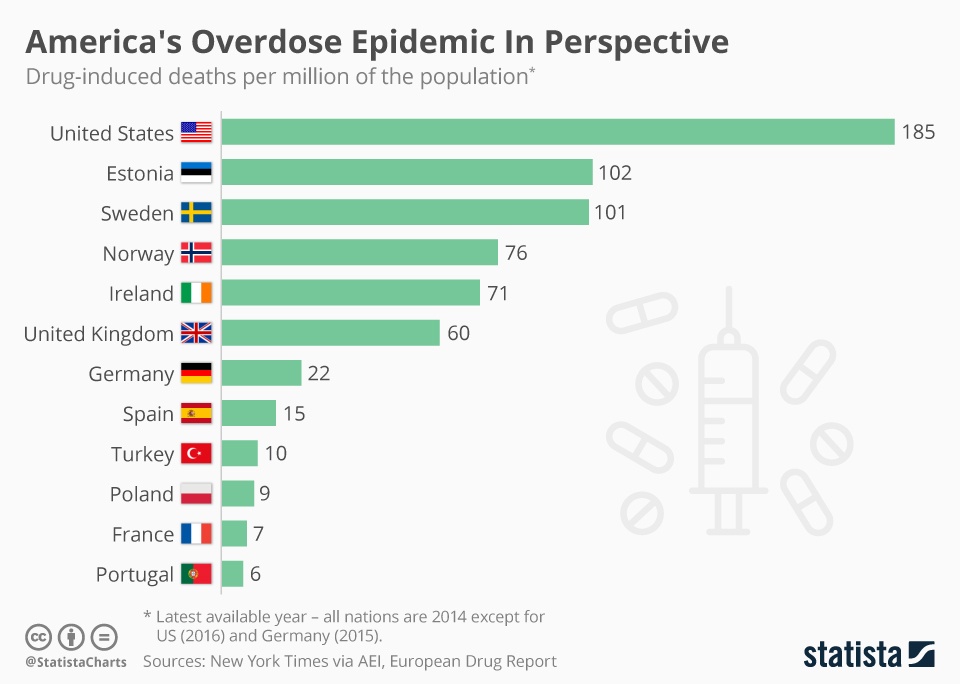
The United States has the most drug-induced deaths of any country by a large margin.
Fentanyl Consumption by Country
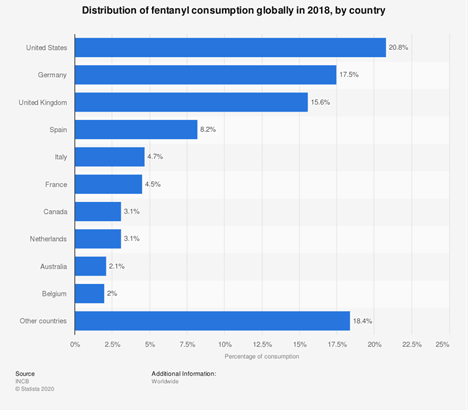
As of 2018, the United States consumes the most fentanyl globally.
Estimated Drug-Related Deaths Internationally
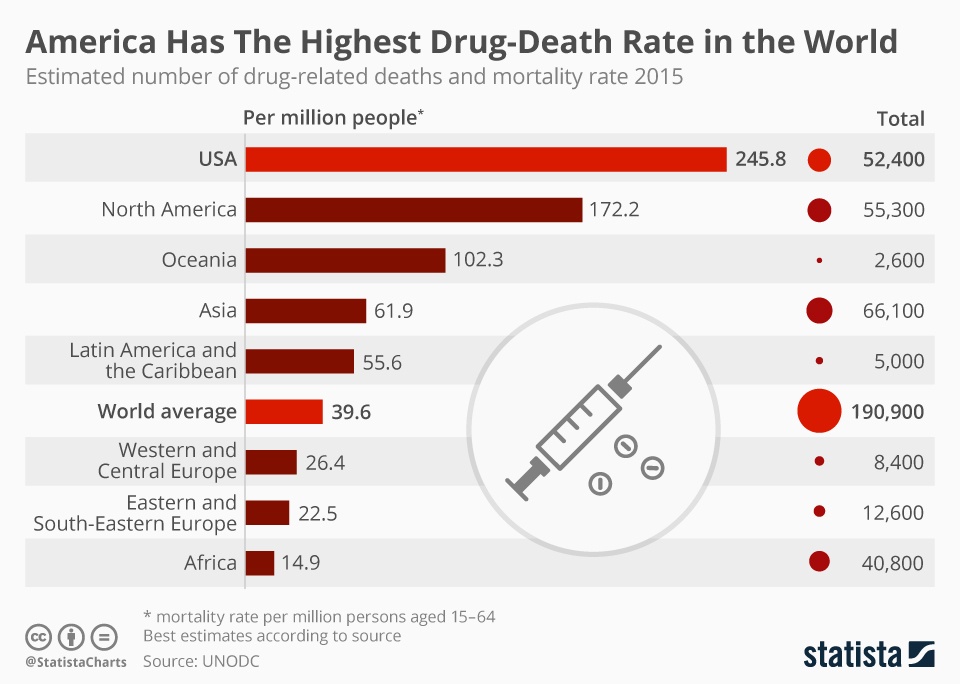
The United States nearly doubles the rate of the drug-deaths in every other major geographic region.
Addiction Statistics – United States
Number of Drug Overdose Deaths by Region and Drug Type
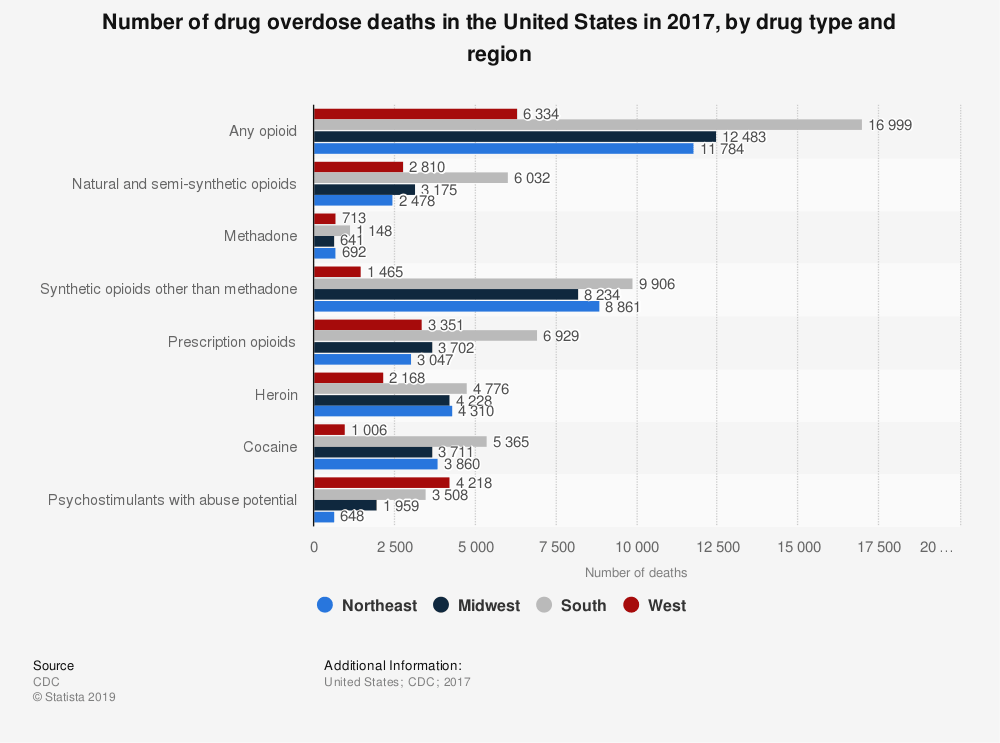
Drug overdose deaths are much more correlated with opioid use in every region. The regions that have the greatest number of drug overdose deaths are the South and Midwest in nearly every category.
States with Highest Fentanyl Overdose Death Rates
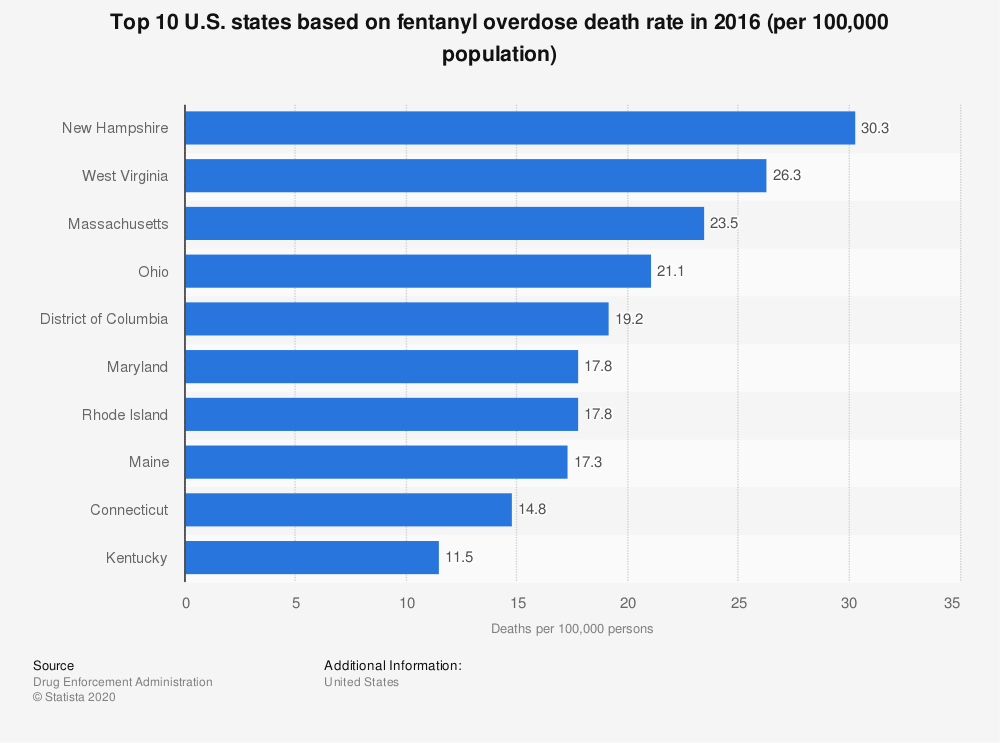
As of 2016, New Hampshire, West Virginia, and Massachusetts had the highest rates of fentanyl overdose death rates.
Overall Drug Overdose Death Rates by State
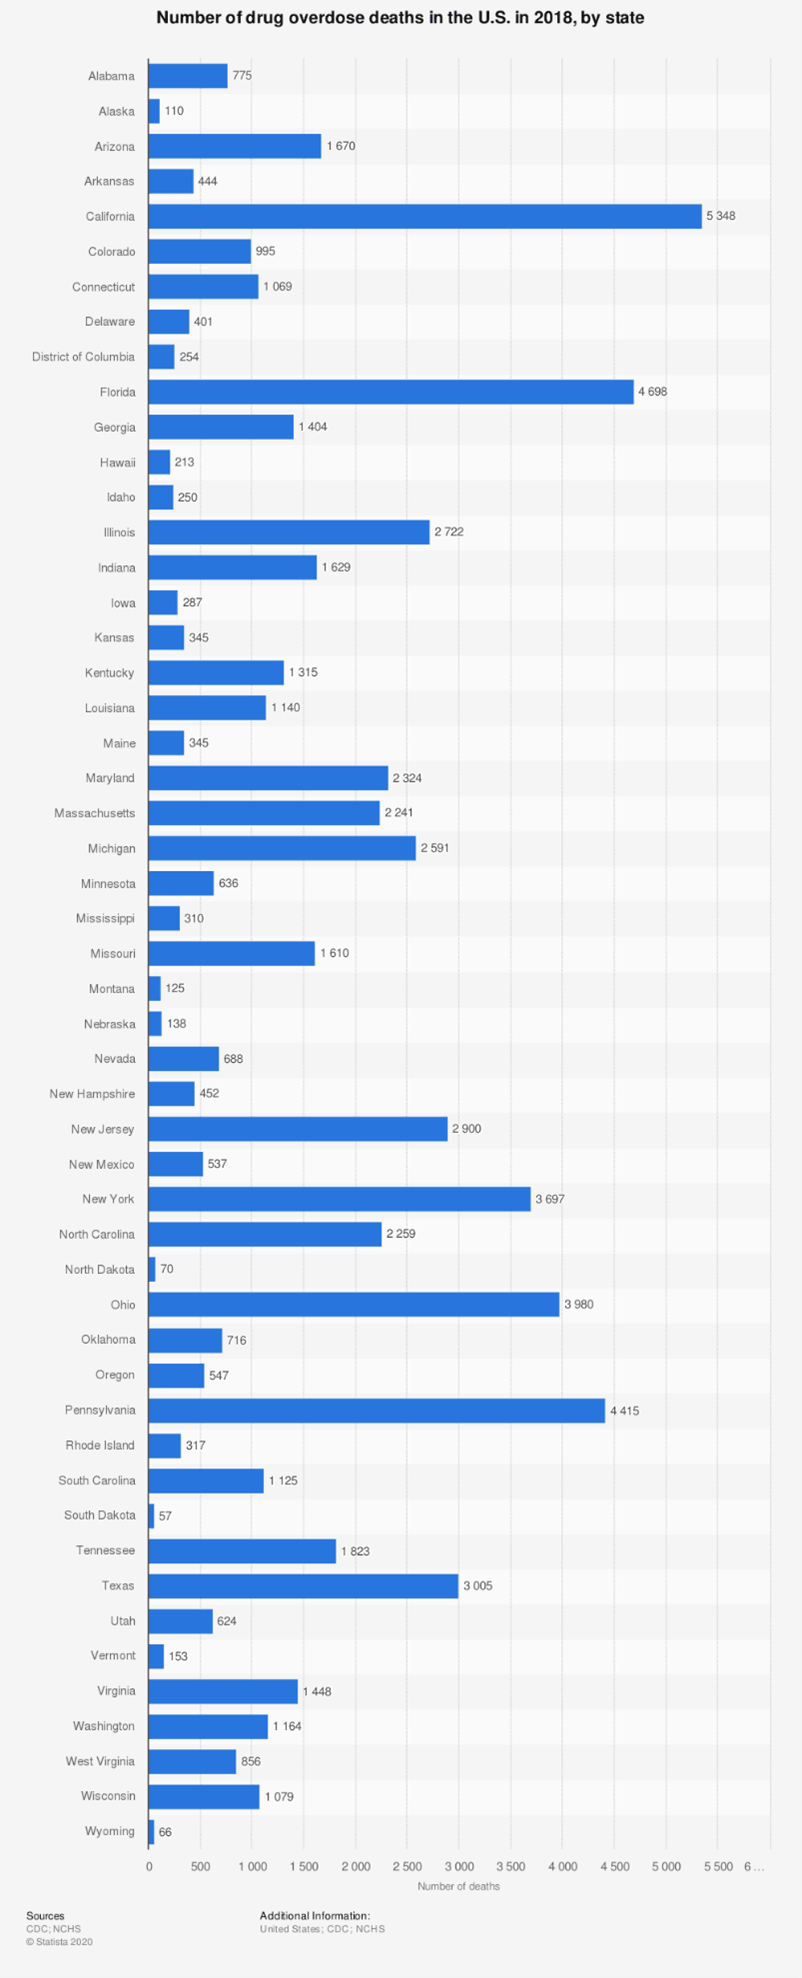
In 2018 the states with highest overdose death rates varied, but some commonalities included higher rates in the South and along the coasts.
Overdose Death Rates by Level of Urbanization
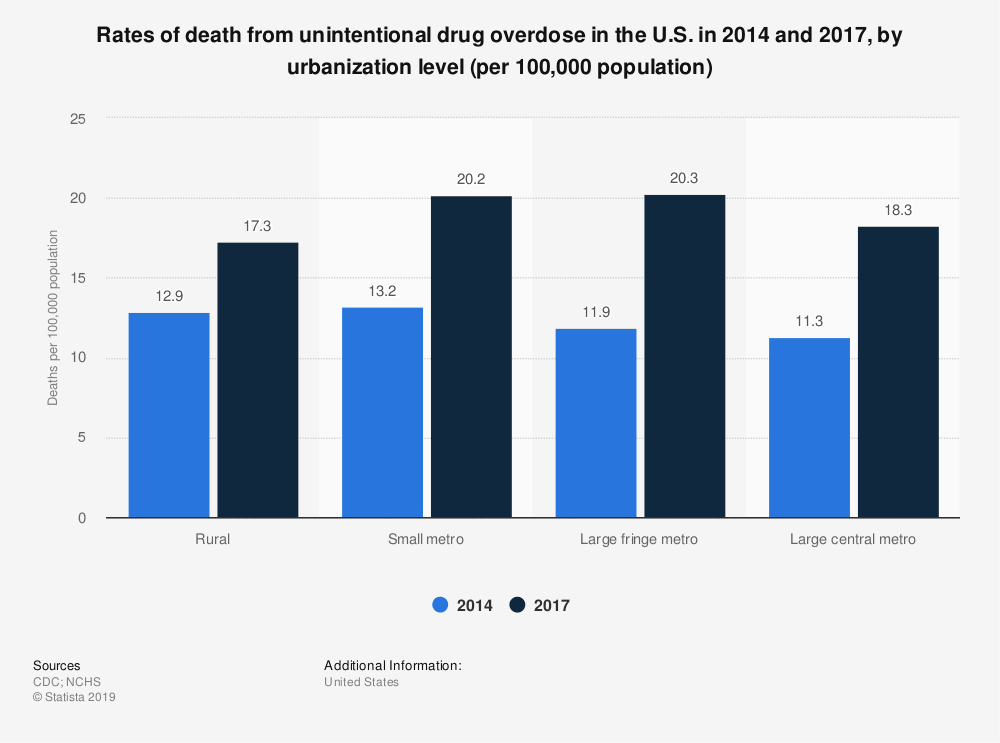
Every community, whether rural or urban, shows increases in drug overdose rates from 2014 to 2017.

We’ll Lead You to New Heights
Do you have more questions about addiction statistics? Reach out.
Impacts of Addiction by Ethnicity, Age, Sexual Orientation, and Gender
Addiction Impacts by Ethnicity
Heroin Overdose Death Rates by Ethnicity
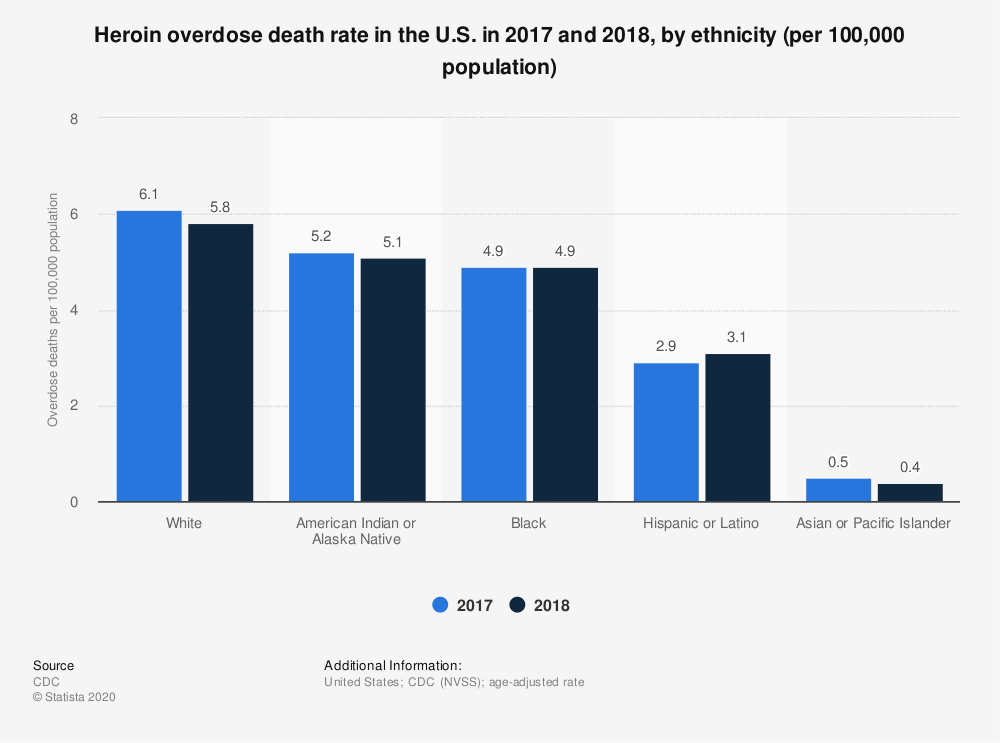
White, Native, and Black communities represent disproportionately high rates of heroin overdose death rates.
Prescription Opioid Overdose Death Rates by Ethnicity
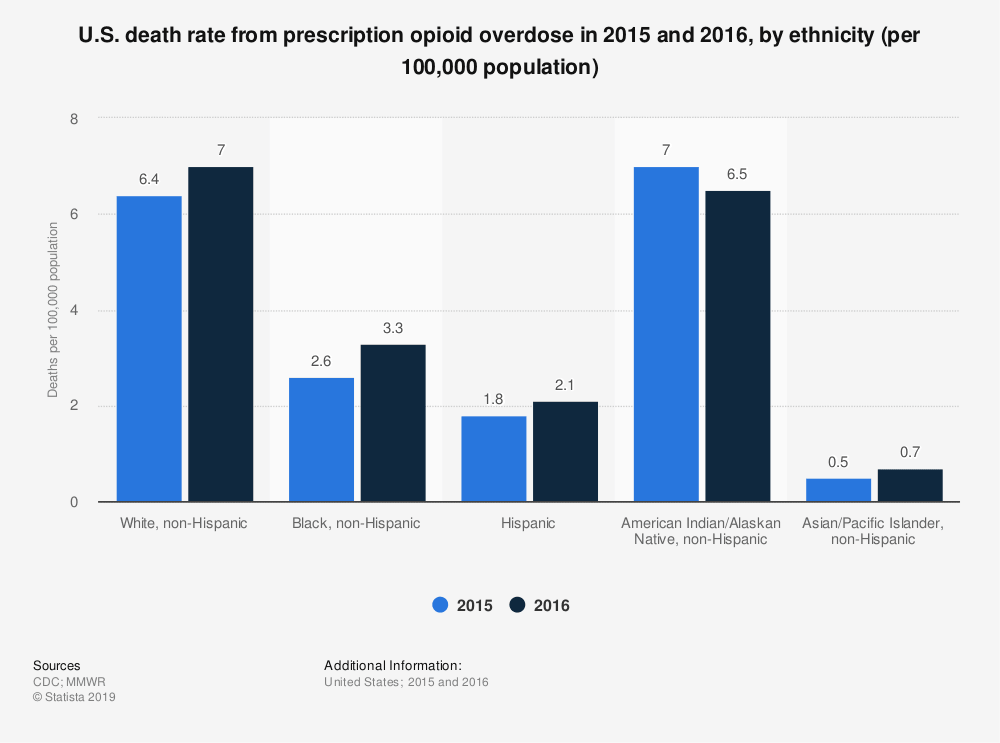
White communities and Native communities represent a disproportionately high rate of prescription opioid overdose deaths.
Percentage of US Hispanic Population Using Illicit Drugs
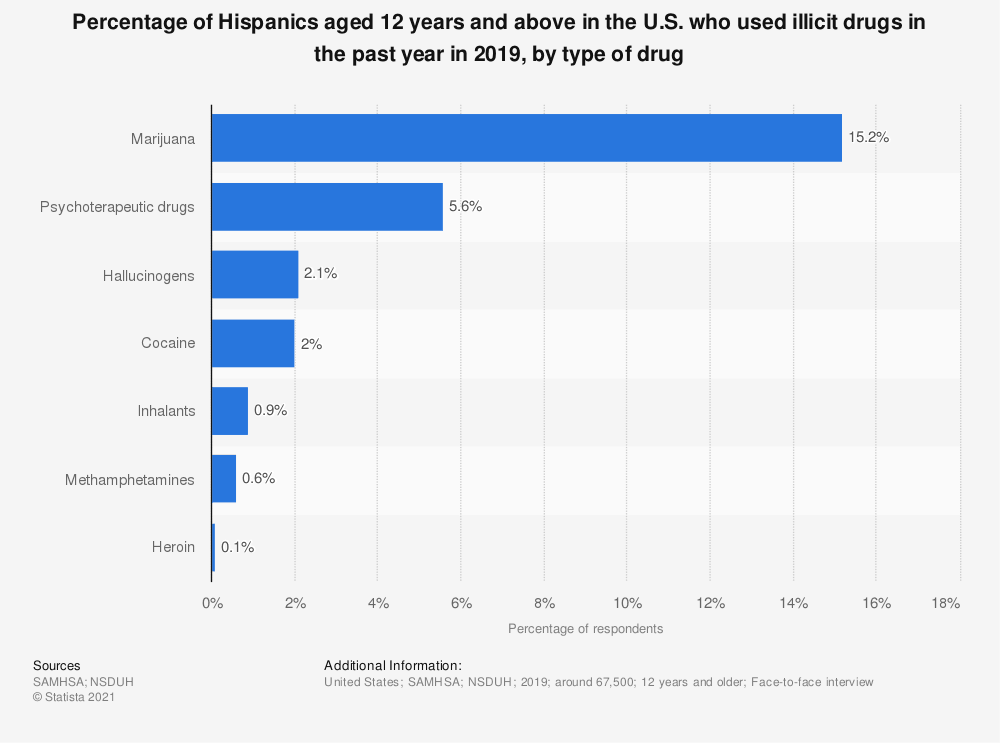
Latinos are more likely to use marijuana than any other illicit drugs
Percentage of US African American Population Using Illicit Drugs
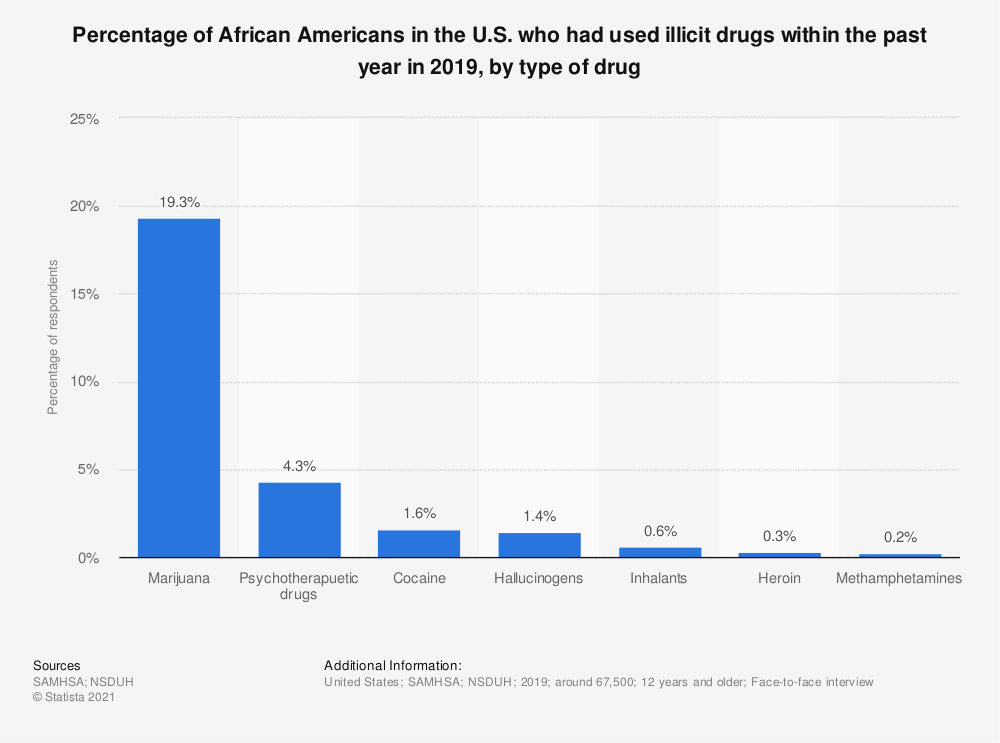
African Americans are more likely to use marijuana than any other illicit drug.
Addiction Impacts by Age
Use of Illicit Drugs in Grades 8, 10, and 12
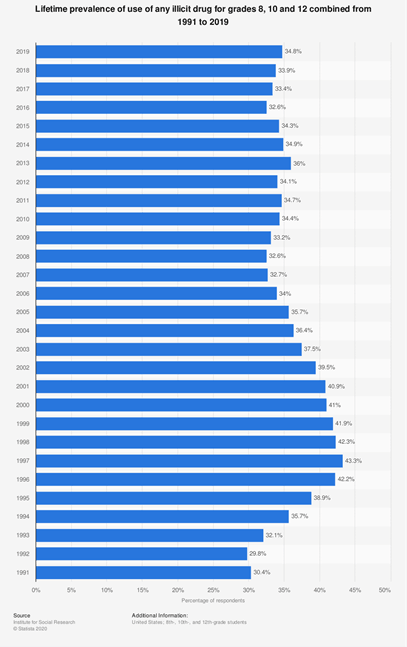
Over 1/3 of 8th 10th and 12th graders have used illicit drugs at some stage in their life.
Percentage of High School Students Using Cocaine by Gender, Ethnicity, and Sexual Identity
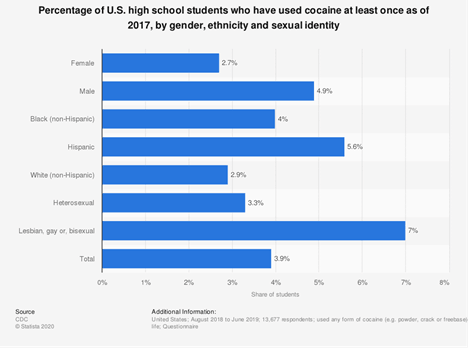
LGBTQIA high school students use cocaine at twice the rate that heterosexual students do based on this data.
Addiction Impacts by Sexual Identity
Number of LGBTQIA Adults Who Reported Illicit Drug Use
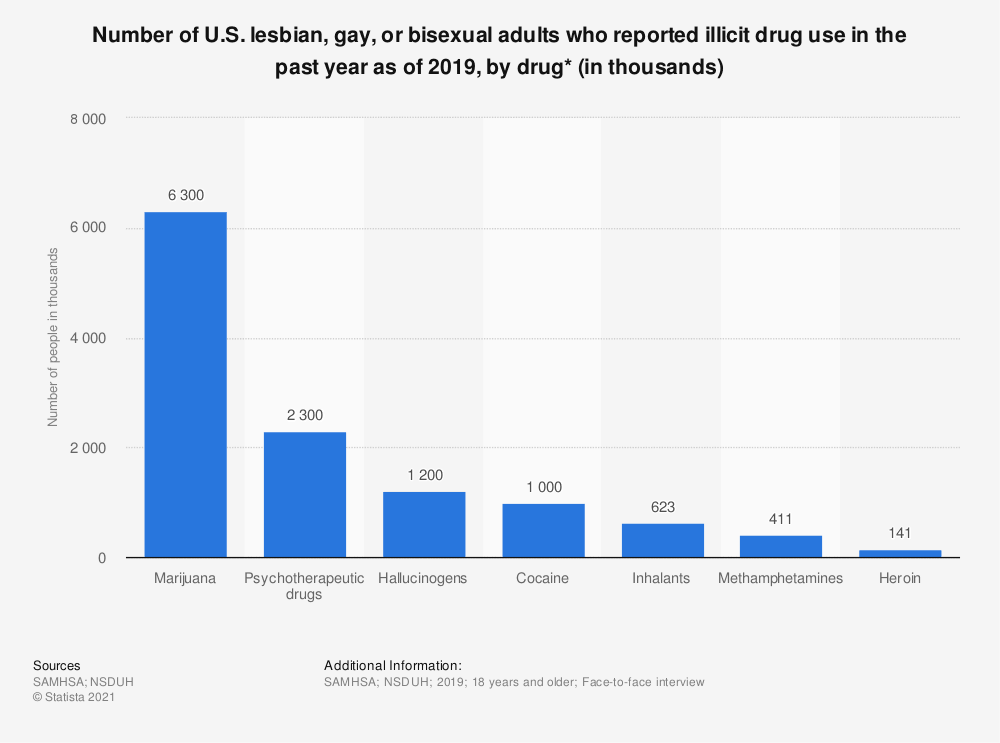
The most commonly used illicit drug in the LGBT community, like many other communities, is marijuana.
Addiction Impacts by Gender
US Prescription Opioid Overdose Death Rate By Gender
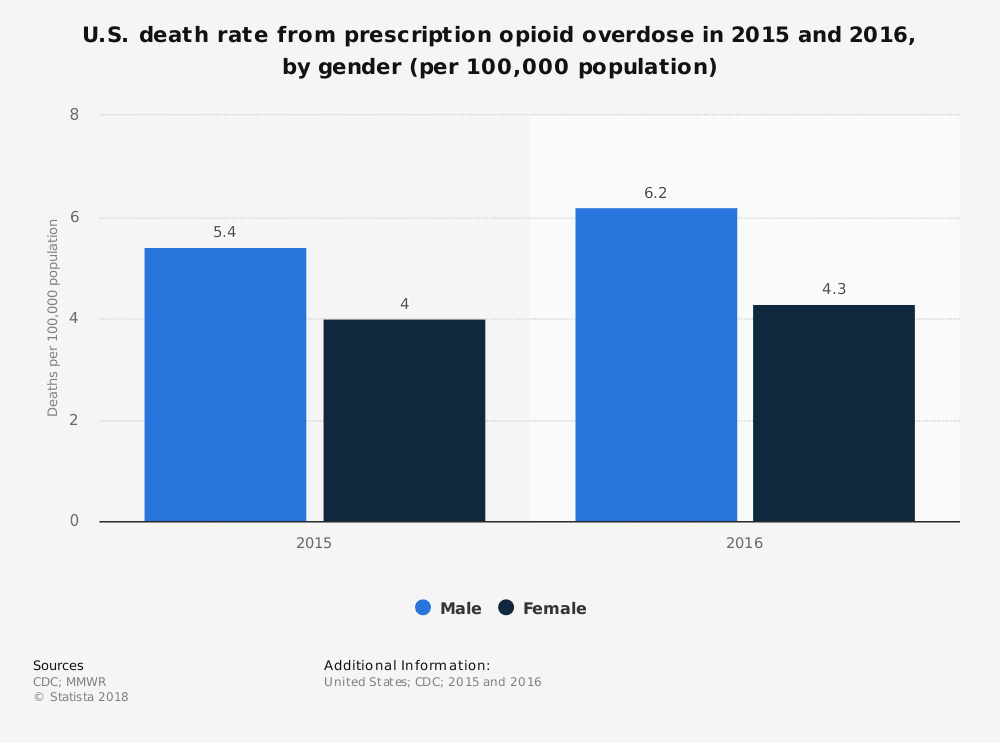
Men have a higher rate of prescription opioid deaths than women, and each gender saw increases in prescription opioid death rates.
Current Alcohol Use by Gender
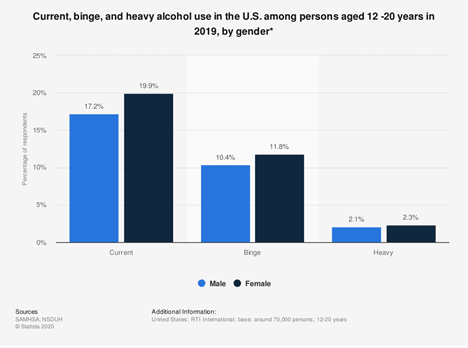
Women have a higher percentage of alcohol consumption, regardless of the degree of usage.
US Fentanyl Overdose Deaths By Gender
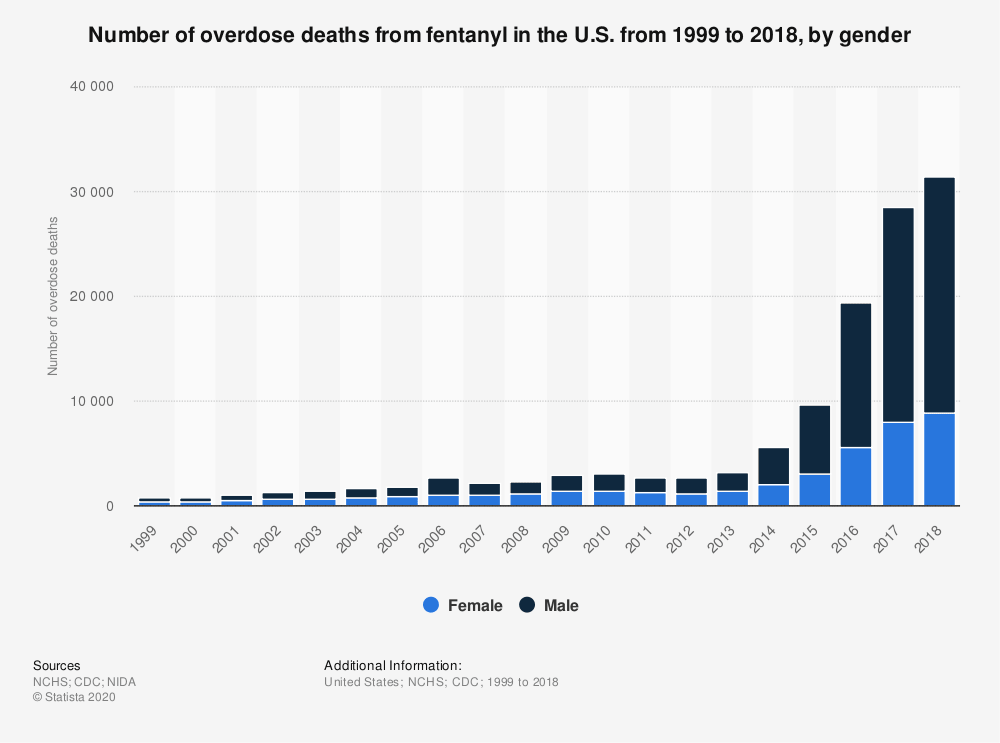
The number of overdose deaths from fentanyl disproportionately affects males.
Percentage of US Women Using Illicit Drugs
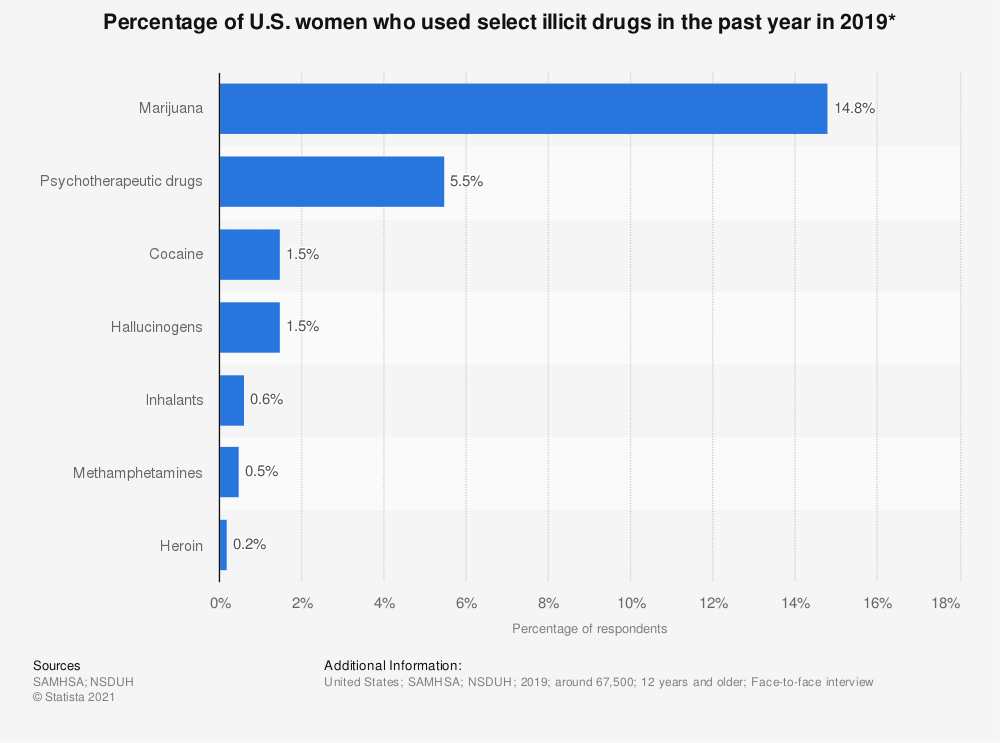
The majority of women using illicit drugs use marijuana.

We’re Here To Help You Find Your Way
Do you need advice about addiction statistics? Reach out today.
Overdose Crisis Statistics
United States Overdose Crisis by Opioid Category
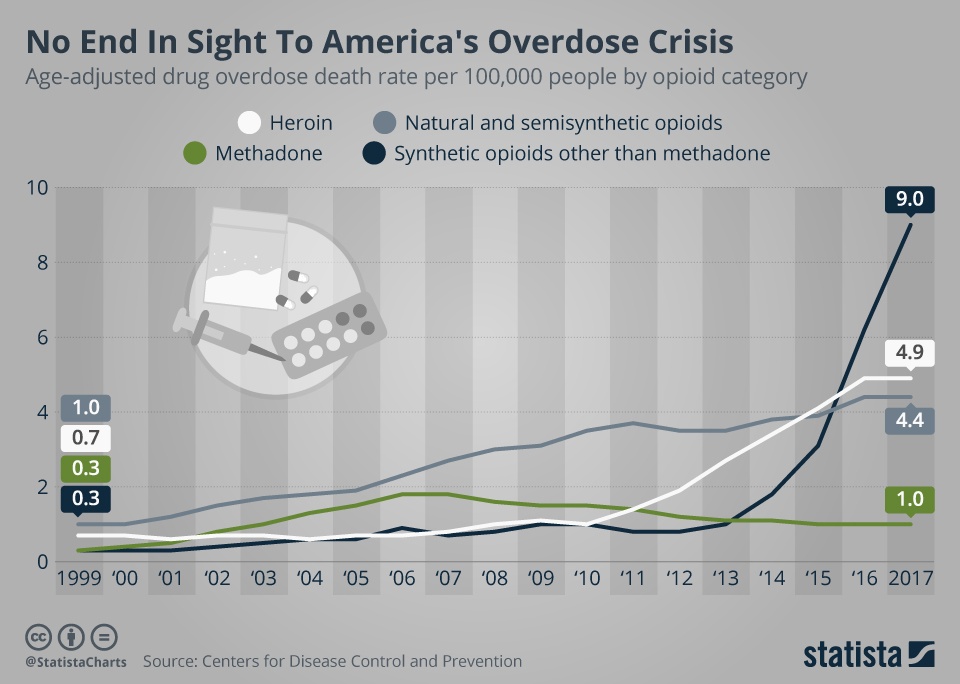
Drug overdose death rates have increased at alarming levels since 1999, particularly synthetic opioids, for which overdose death rates are growing nearly exponentially.
US Drug Overdose Deaths Year over Year
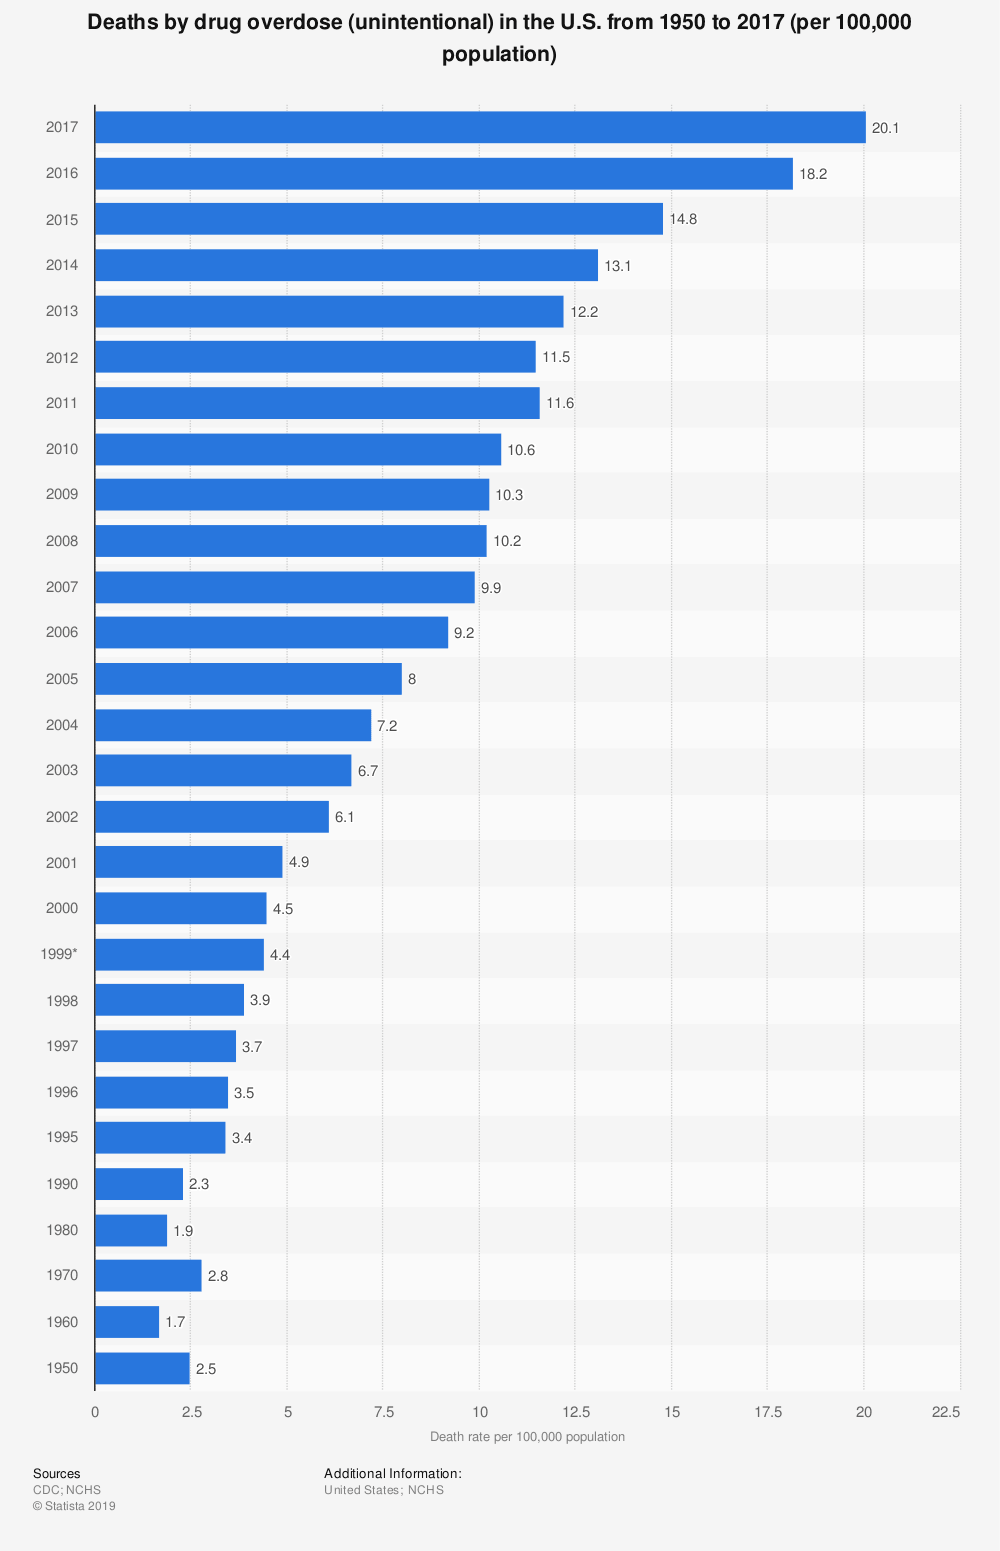
Drug overdose deaths have increased drastically since 1950, now representing 20 deaths per 100,000 population.
Percent Change in Drug Overdose Deaths by State
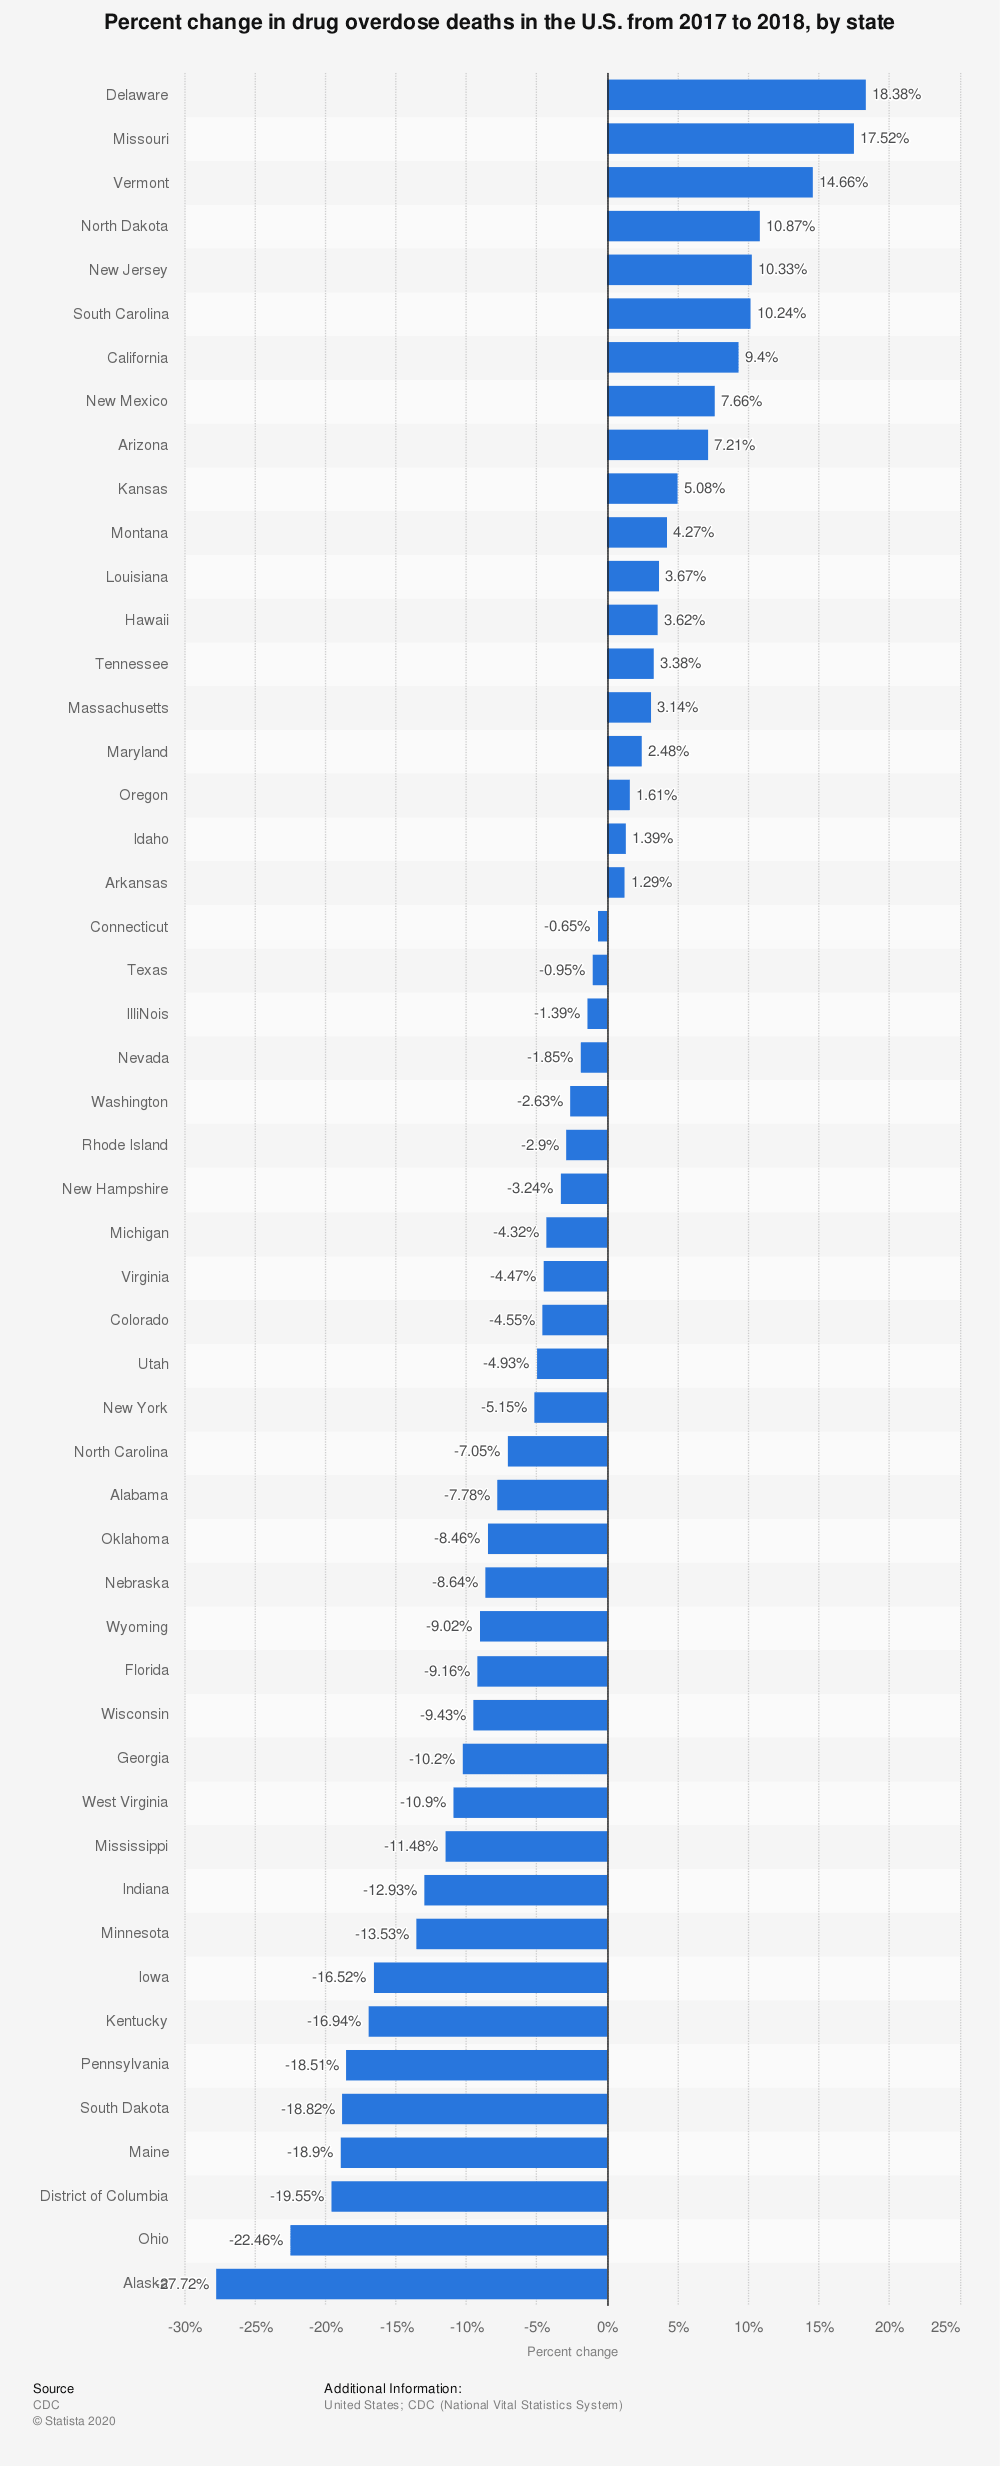
Many states saw decreases in drug overdose deaths in the period from 2017 – 2018.
Overdose Statistics by Age Group
Drug Overdose Deaths By Age
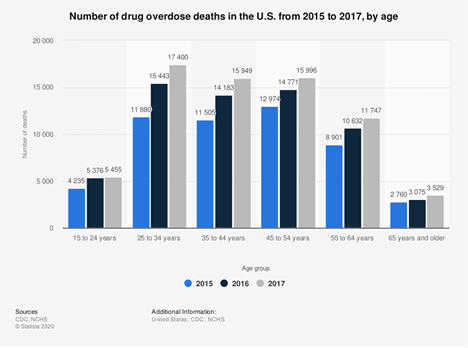
Drug overdose deaths have increased in every age category, and particularly impacts those 25 to 34 years old.
Nonfatal Overdose Emergency Room Visits by Age
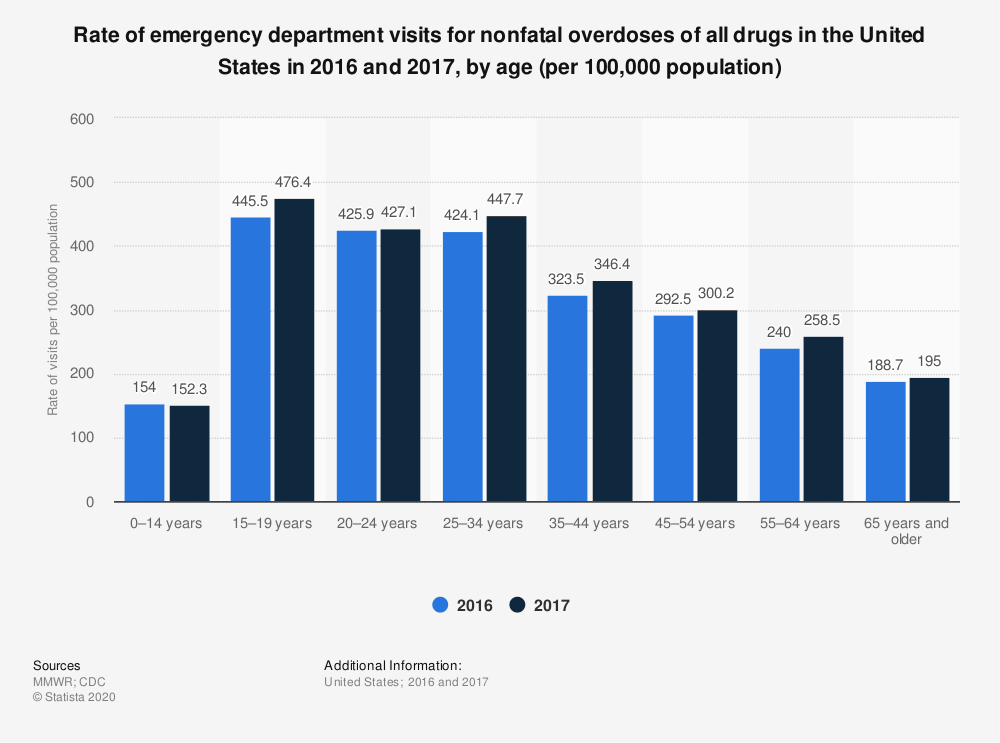
Nonfatal overdose emergency room visits were higher in every age group in 2017 than in 2016. In both years, ages 15-19 had the highest rates of needing emergency medical care for overdose.
Overdose Statistics by Occupation
Number of Prescription Opioid Overdose Deaths by Occupation
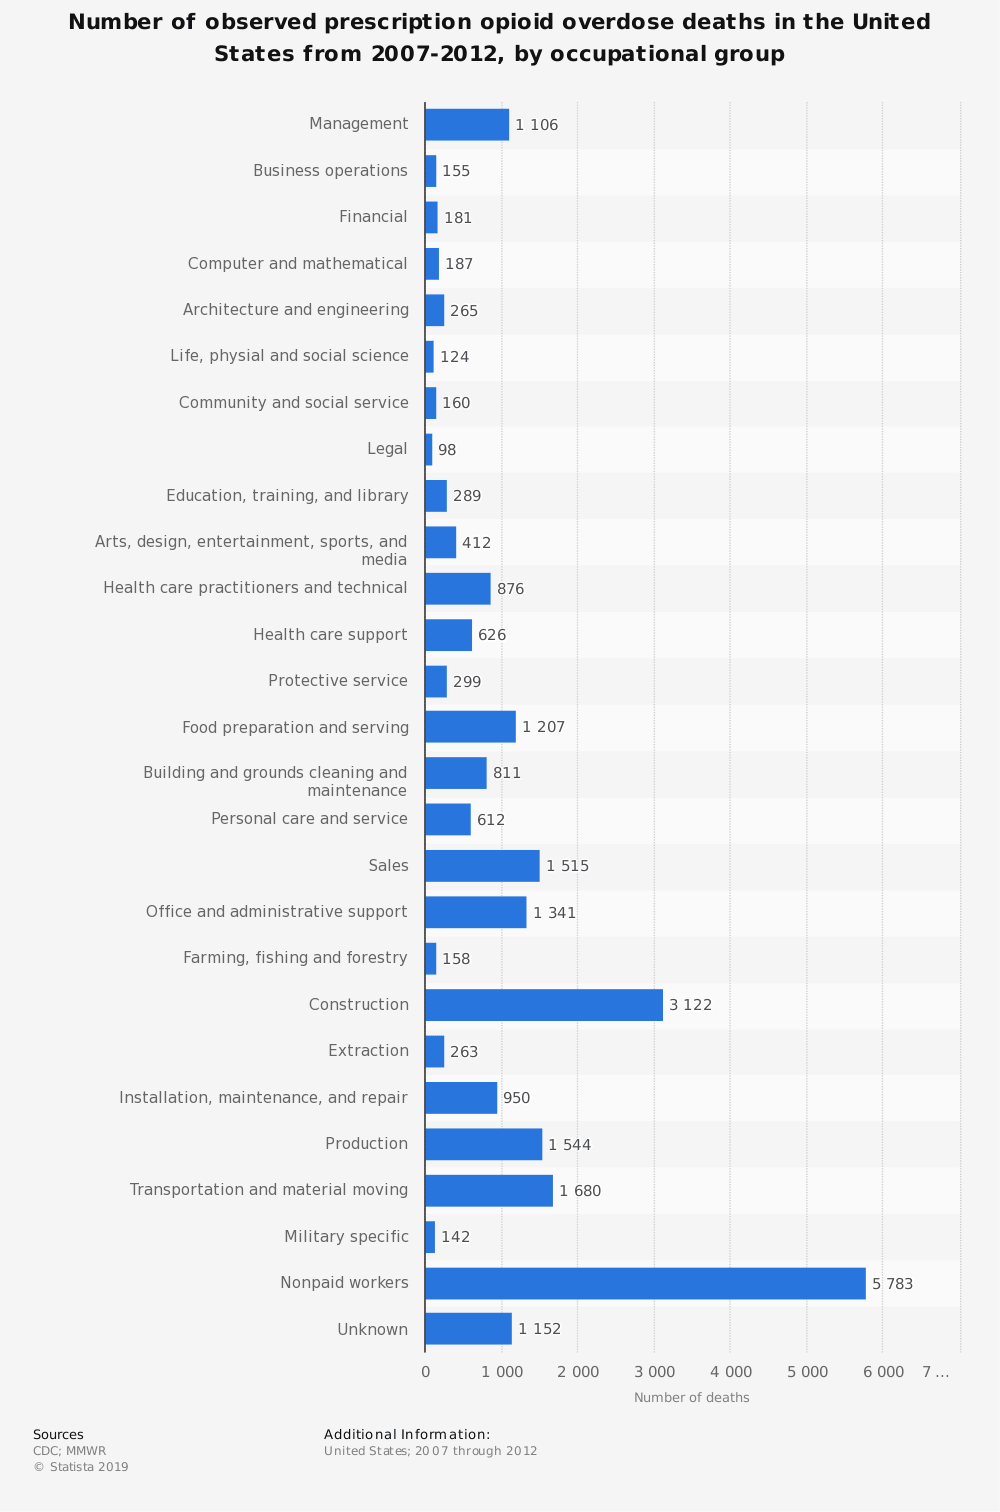
Prescription opioid deaths impact nearly all occupational sectors. Notably, construction, management, and nonpaid workers have the highest numbers of prescription opioid deaths.
Number of Heroin Overdose Deaths by Occupation
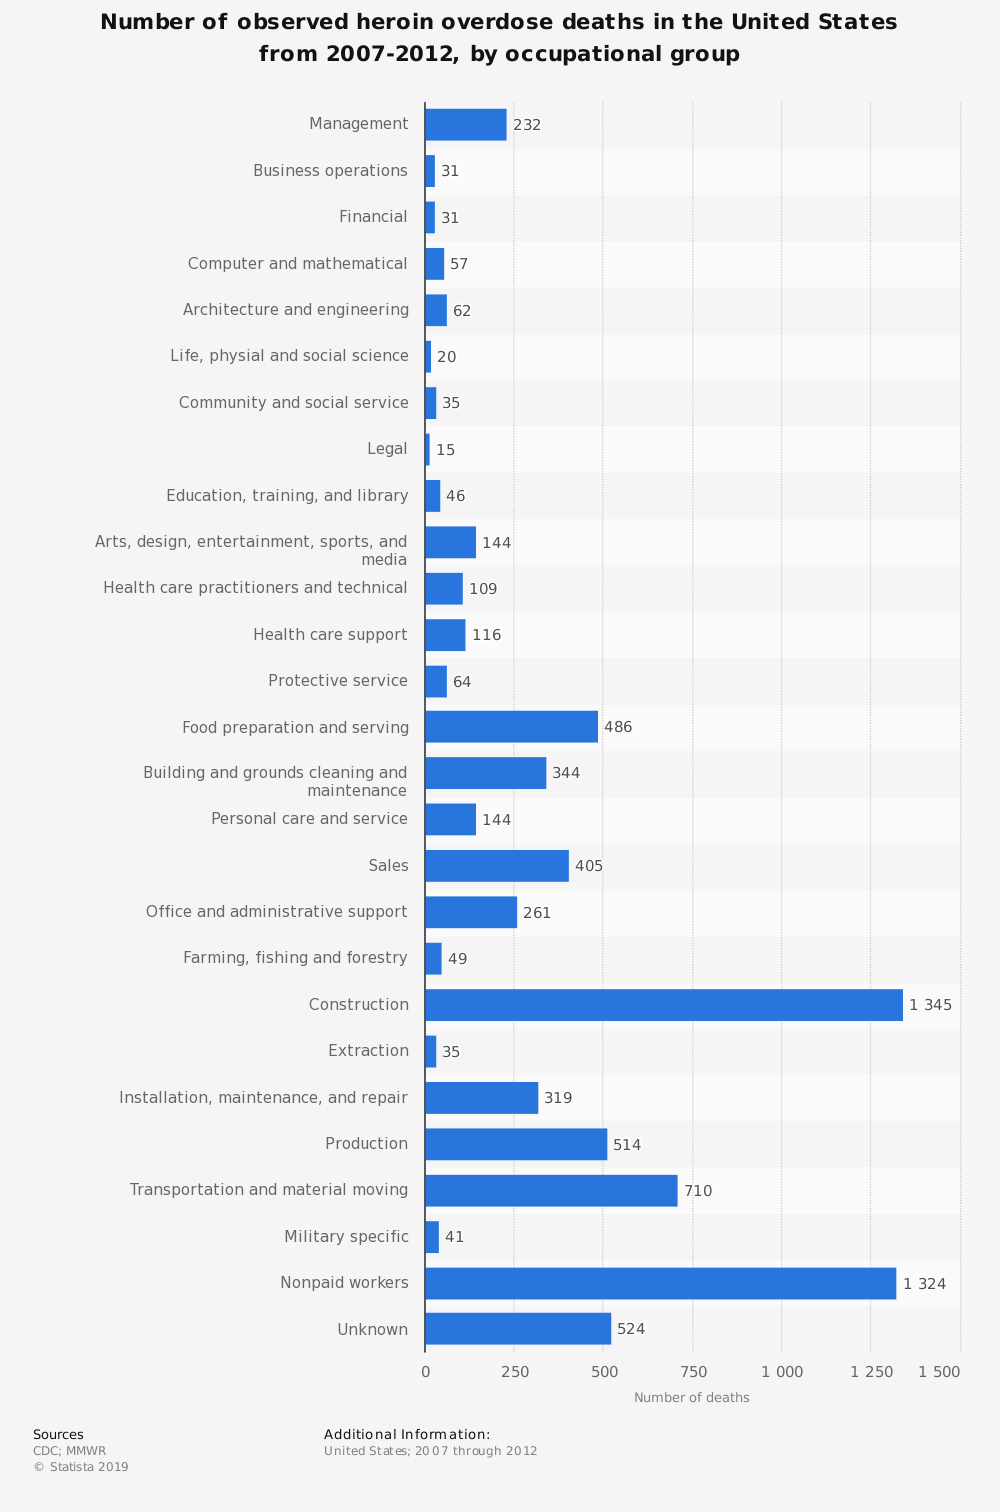
Construction has the highest rates of heroin overdose rates, followed closely by nonpaid workers.
Overdose Statistics by Substance
Number of Drug Overdose Deaths By Drug Type
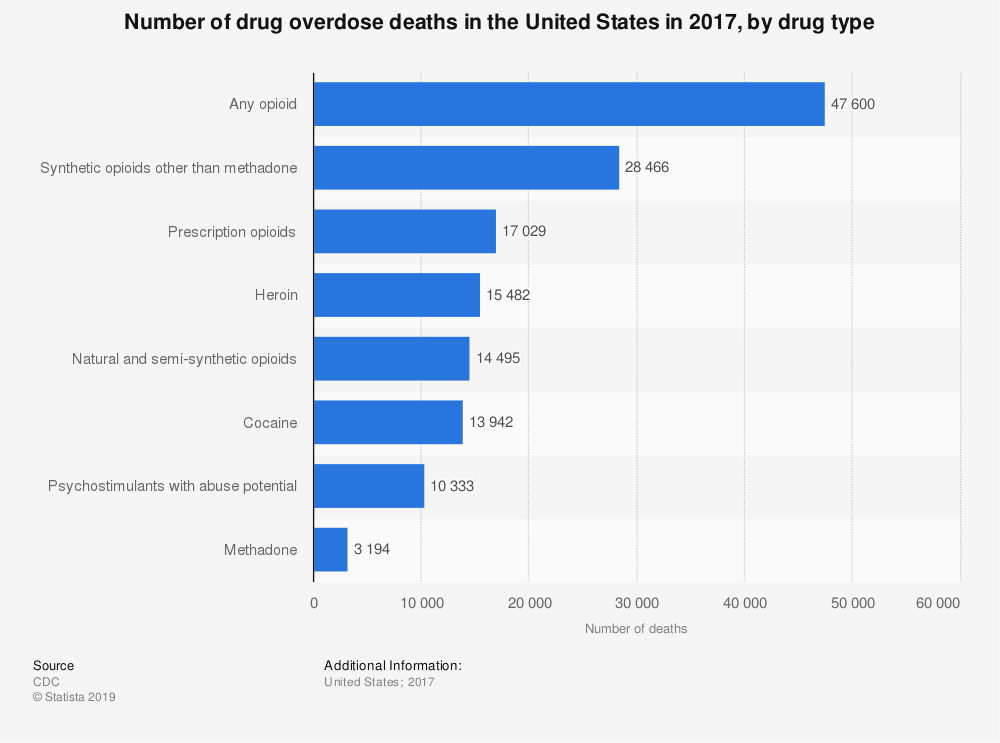
Opioids were the primary drug type responsible for overdose deaths, followed closely by heroin and cocaine.
Number of Overdose Deaths by Specific Drugs
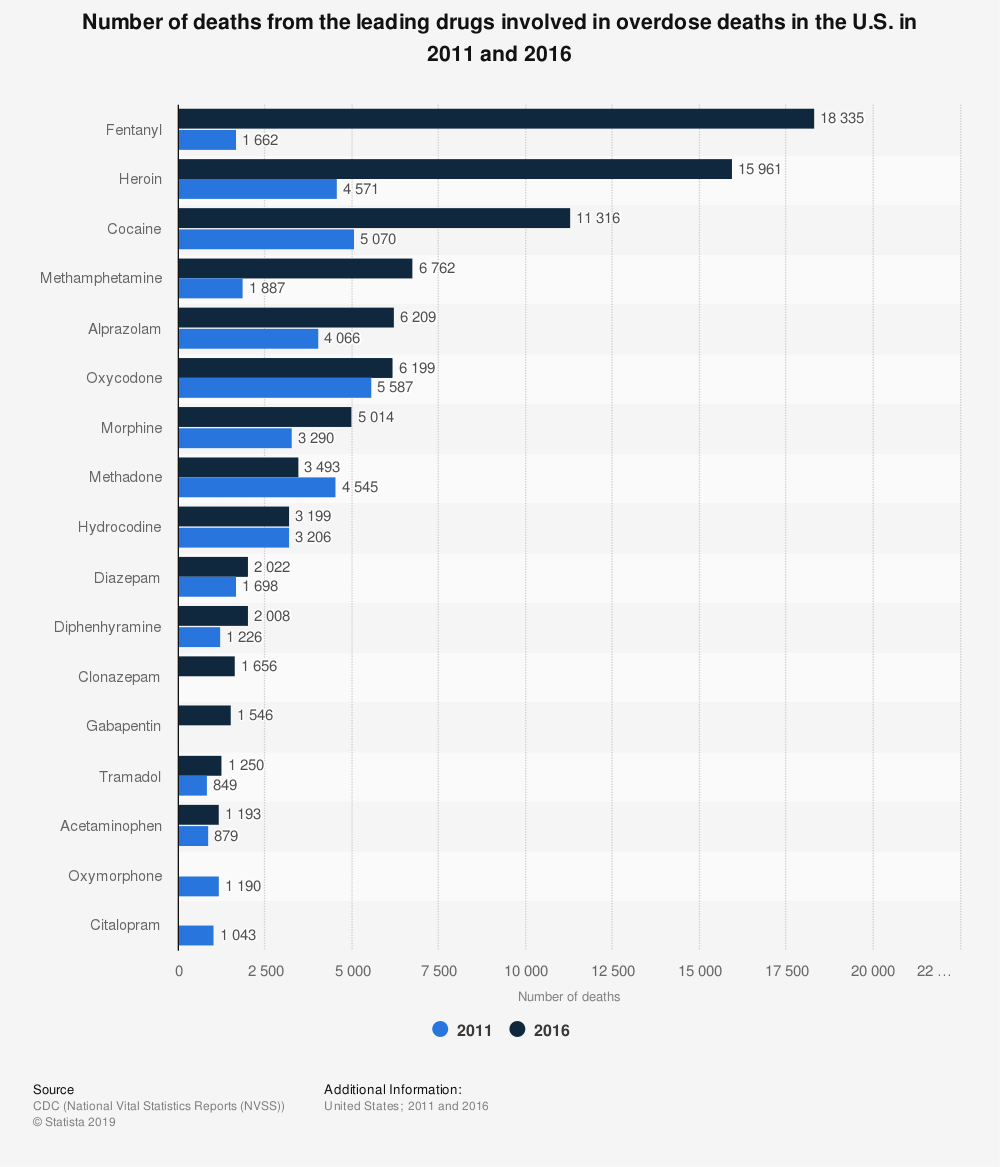
When measuring against other drugs, fentanyl causes the most overdose deaths, followed closely by heroin overdose death rates and cocaine overdose death rates.
Deaths Related to Alcohol-Related Illnesses Have Doubled
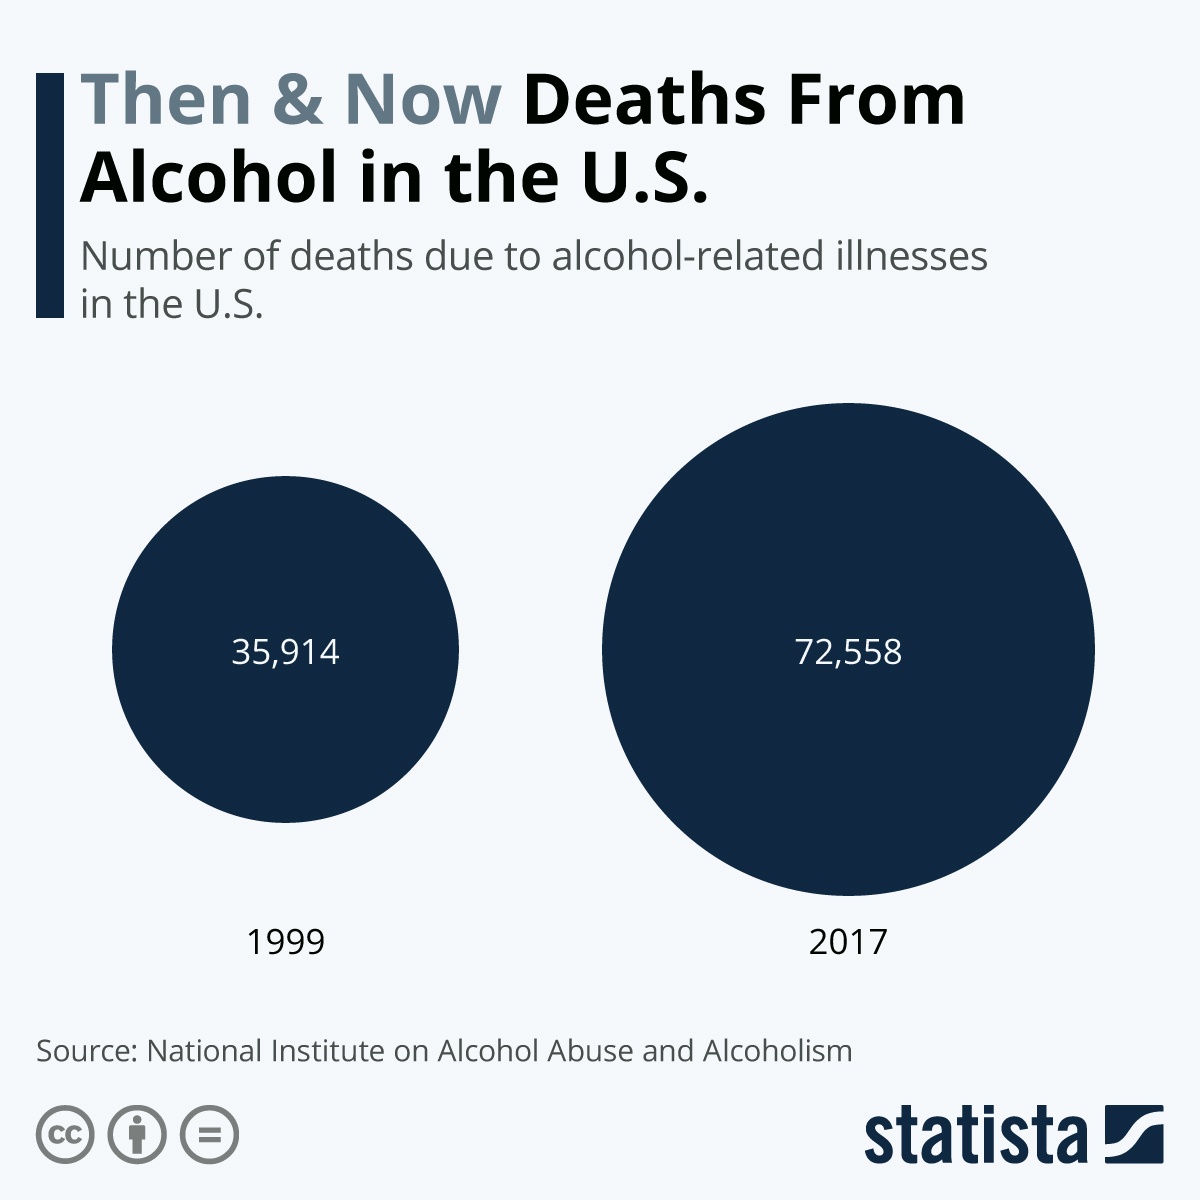
Between 1999 and 2017 alcohol-illness-related deaths have doubled. These death counts do not include drunk driving incidents, etc.
Drug Overdose Deaths Involving Fentanyl
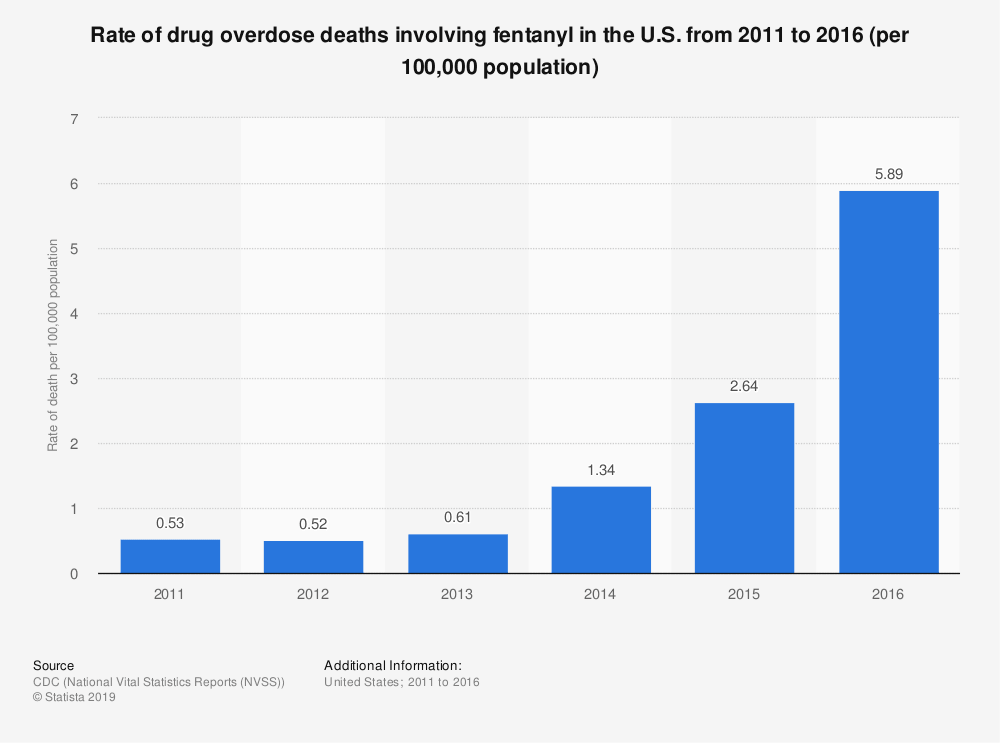
The rate of drug overdose deaths involving fentanyl has increased drastically since being measured in 2011.
Number of Individuals with Reported Heroin Dependence or Use
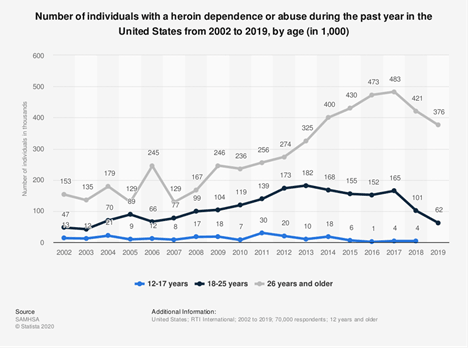
The number of individuals with heroin dependencies in each age group increased steadily until 2017. The numbers around 2020 may have once more been inflated due to COVID-19.
Number of Overdose Deaths From Fentanyl Year over Year
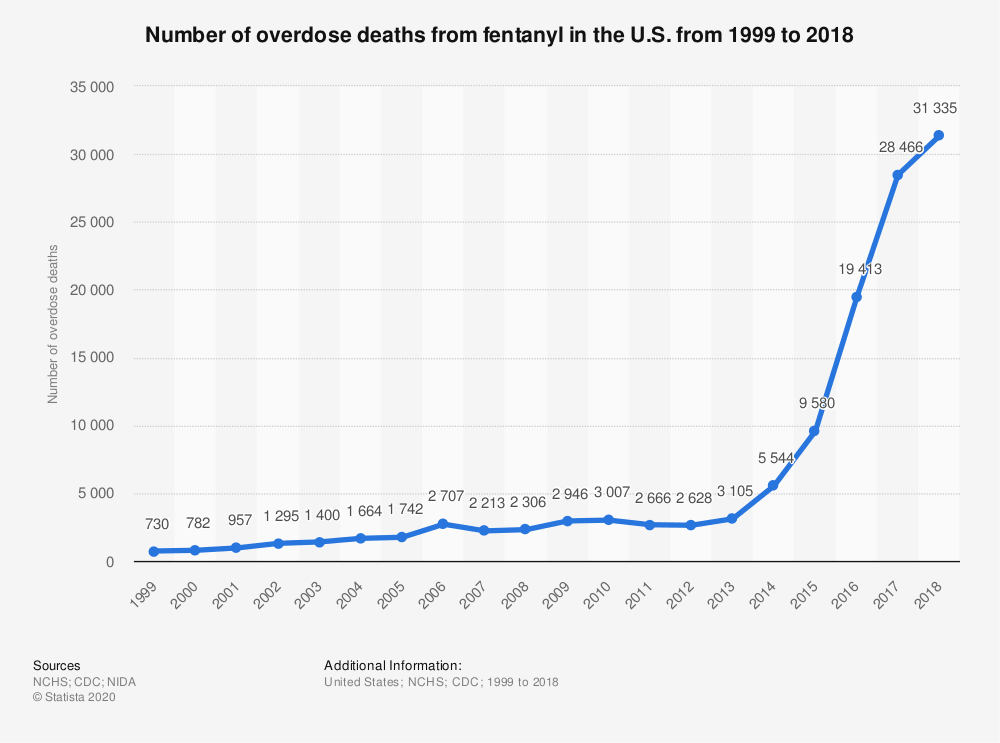
Fentanyl overdose deaths have increased at a nearly exponential rate from 1999 to 2018.
US Sources of Misused Prescription Painkillers
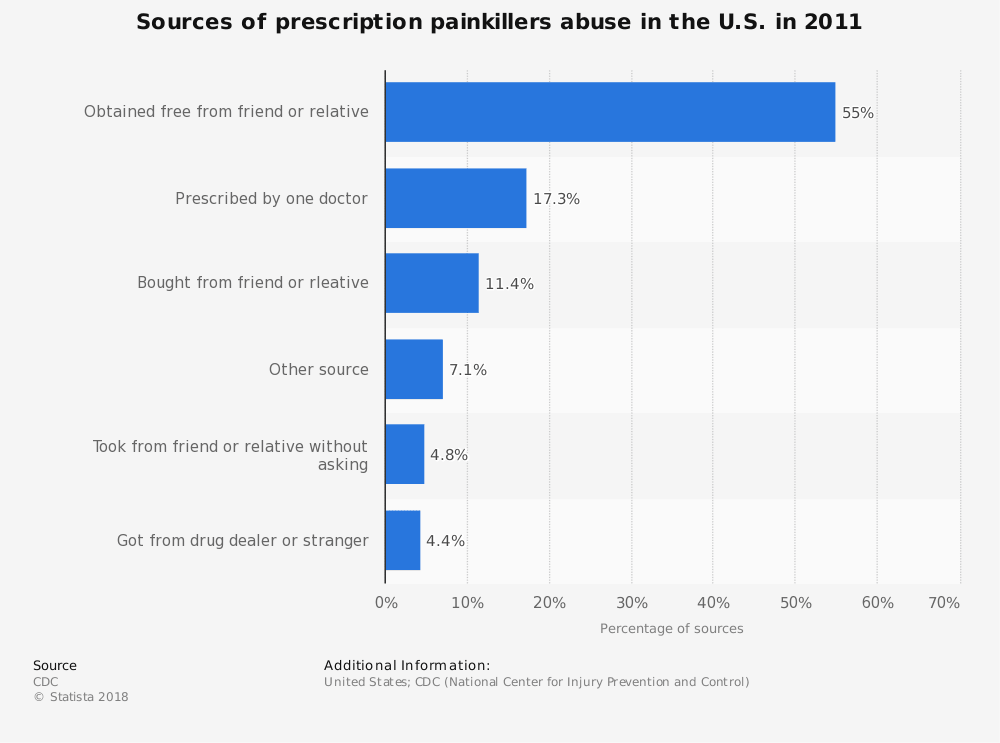
Over half of the painkiller abuse sources are friends or relatives.
Addiction Treatment Statistics
Total Number of Substance Abuse Treatment Facilities Year over Year
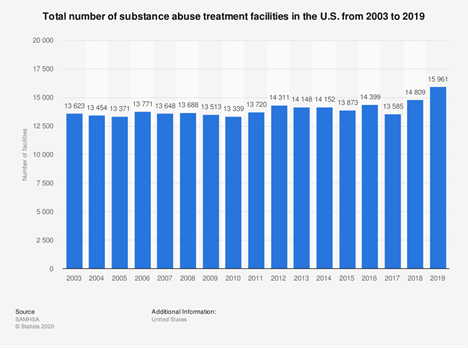
There has been mild but steady growth in the number of addiction treatment centers in the United States.
Rates of Seeking Addiction Treatment By Substance
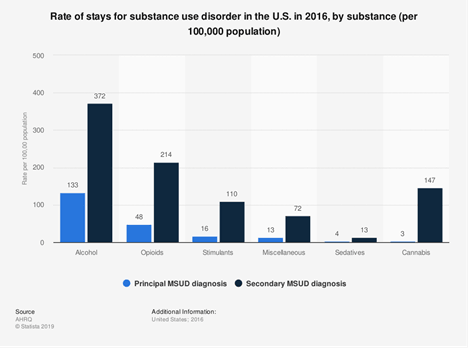
The highest rates of engaging addiction treatment services come from those who struggle with alcohol, opioids, or stimulants.
References:

We’ll Lead You to New Heights
Would you like more information about addiction statistics? Reach out today.
The State Of Substance Abuse
As a drug rehab in Santa Ana, The Edge Treatment Center sees the effects of substance abuse and drug & alcohol addiction every day. Addiction doesn’t discriminate; it affects everyone: Rich and poor, young and old.
Unfortunately, 2021 was a banner year for addiction. For the first time in US history, drug overdose deaths topped 100,000, according to a landmark CDC report. Meanwhile, the anxiety, anger, and depression caused by deaths, uncertainty, and lockdowns have continued to be powerful drivers for substance abuse, addiction, and overdoses due to the ongoing COVID-19 outbreak.
Also, the powerful synthetic opioid fentanyl continued its presence in illicit drug markets. Vastly more powerful than morphine, this painkiller often contaminates drug stashes, making addiction more dangerous than ever. More than two-thirds of the drug deaths in a 12-month period ending in April 2021 were due to fentanyl.
Our addiction statistics page is your guide to the current state of drug and alcohol addiction in the US. All data is from the most recent year available.
Drug Overdose: Overdose Statistics
Put simply, a drug overdose is what happens when a person takes too much of an addictive substance or a combination of substances. Overdose is a major risk of substance abuse. It’s possible to overdose on over-the-counter medications, legal substances such as alcohol and cannabis, and illicit drugs like methamphetamines or heroin.
Opioid overdoses are sadly among the most common kinds of drug overdoses.
How Do People Overdose On Opioids?
Opioids work by binding to areas on nerves called opioid receptors. When opioids bind to them, these receptors affect how the body sends signals to the brain, which is why we experience pain differently when we take opioids for pain. These receptors are found throughout the body, located in the brain, nervous, and digestive systems.
When these receptors are activated by opioid drugs, the receptors slow down other body processes, like breathing. High doses of opioids – or small doses of powerful opioid drugs like fentanyl – can slow breathing to the point where a person suffocates.
Drug Overdose Deaths Topped 100,000 Annually in 2021
In November 2021, the Centers for Disease Control and Prevention’s National Center for Health Statistics reported fatal drug overdoses reached a new high for a 12-month period ending in April 2021. During that time, 100,306 people fatally overdosed on drugs, including heroin, synthetic opioids like fentanyl, methamphetamines, and more.
Where The Overdose Deaths Happened: States Which Saw The Highest Increases In Drug Overdose Deaths From May 2020 To May 2021
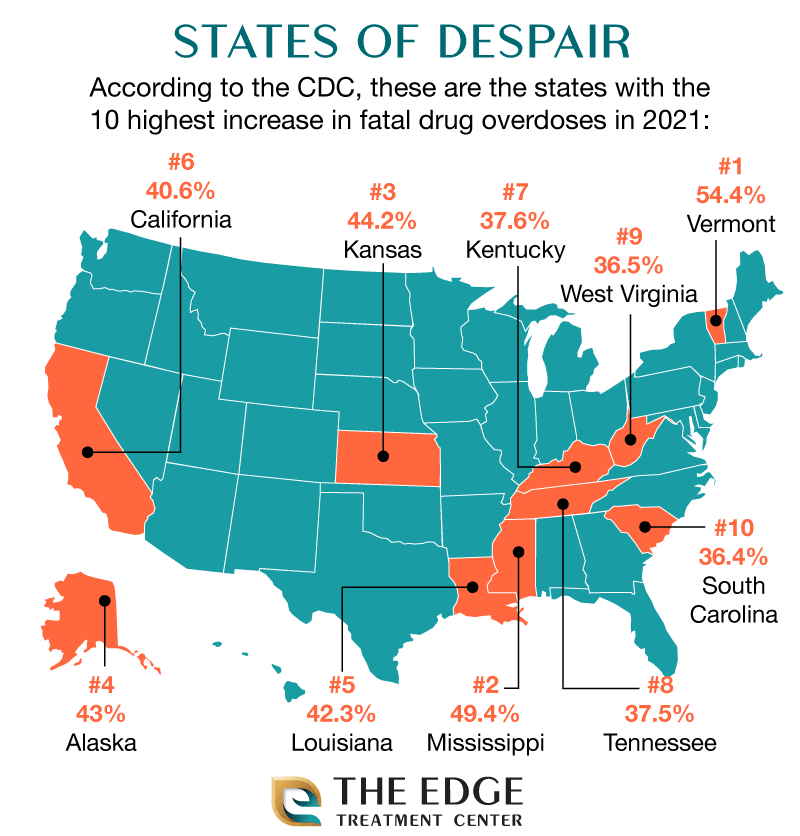
Source: CDC National Center For Health Statistics
Fentanyl Abuse: The Chief Driver Of Overdose Deaths In The US
Back to the CDC’s overdose numbers. Of the over 100,000 drug deaths noted by the agency, they estimate 75,673 deaths were due to opioids ... which includes fentanyl, a synthetic opioid painkiller often available in illicit drug markets.
Fentanyl does have a legitimate medical use. It’s used to treat serious chronic pain, and when used as prescribed it allows people to live relatively comfortable lives. Most fentanyl abused today is made in clandestine labs and then distributed like other illicit drugs. Worse, it often contaminates other drugs. Fentanyl has been found in cocaine, counterfeit Xanax pills, heroin, and more.
What makes fentanyl dangerous is its potency. According to the Drug Enforcement Agency, fentanyl is 80-100 times stronger than morphine.
Put this another way:
30 milligrams = the amount of a lethal dose of heroin
3 milligrams = a lethal dose of fentanyl
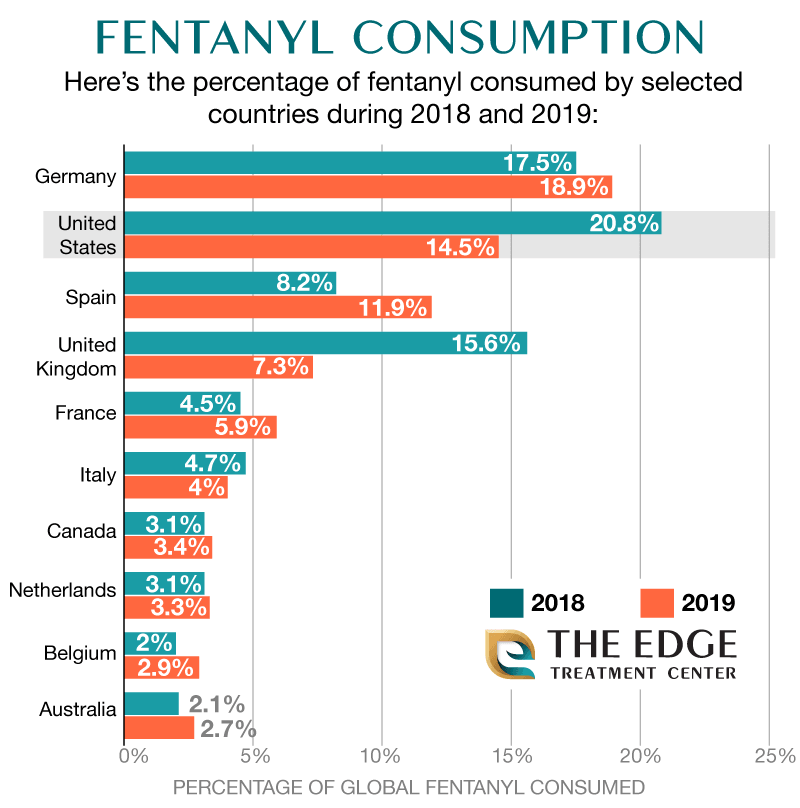
Global Fentanyl Consumption
Between 2018 and 2019 (the most recent years available), the US actually saw its fentanyl use dip noticeably. Germany led the globe in fentanyl consumption in 2019.
Source: Statista.com
SUBSTANCE USE STATISTICS
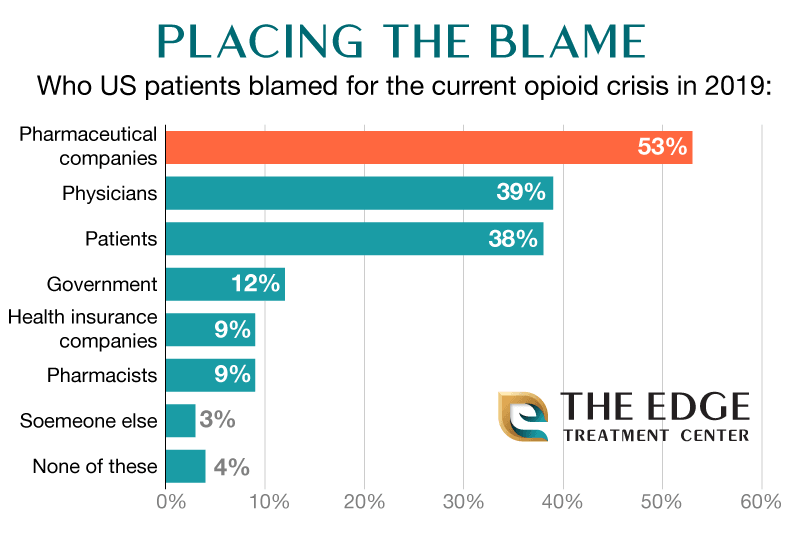
Whose Fault Is The Opioid Crisis?
A 2019 poll published by Statista.com asked patients in the US who they thought was responsible for the current opioid crisis. They overwhelmingly blamed pharmaceutical companies:
Source: Statista.com
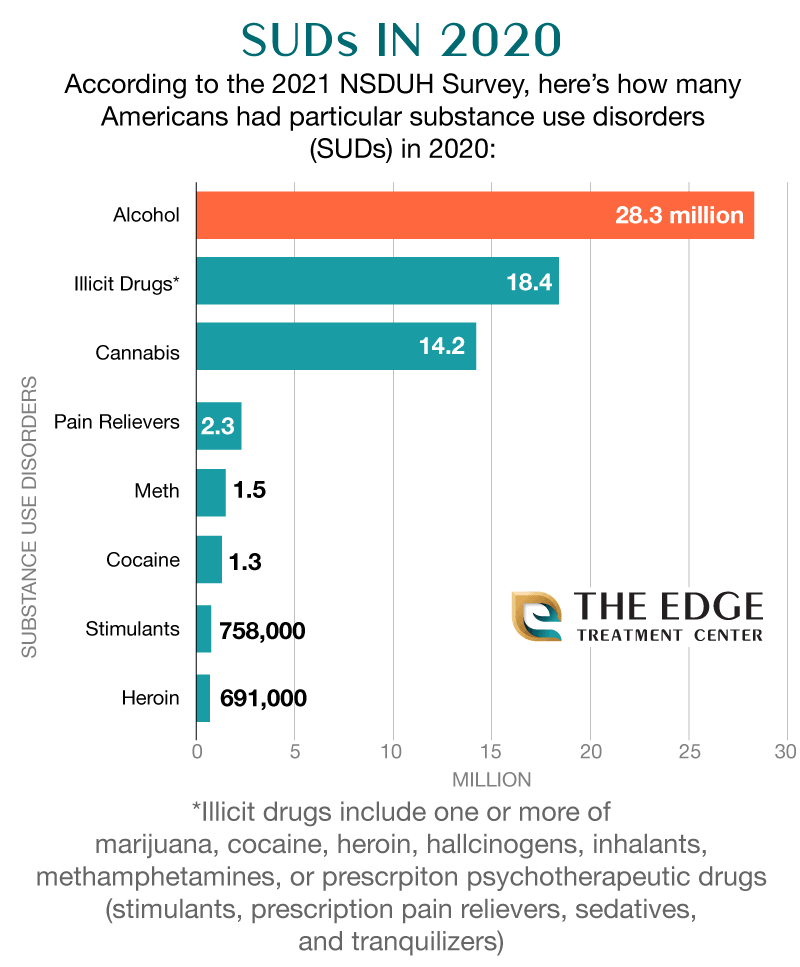
How Common Were Substance Use Disorders In 2020?
According to the annual National Survey on Drug Use and Health (NSDUH) survey conducted by the Substance Abuse and Mental Health Services Administration (SAMHSA), 40.3 million (14.5%) of Americans had a substance use disorder in 2020.
The chart below breaks down the types of substance use disorders. Alcohol is by far the most popular addictive drug; just over 28 million Americans had an alcohol use disorder in 2020:
Source: 2020 NSDUH survey
ADDICTION TREATMENT STATISTICS
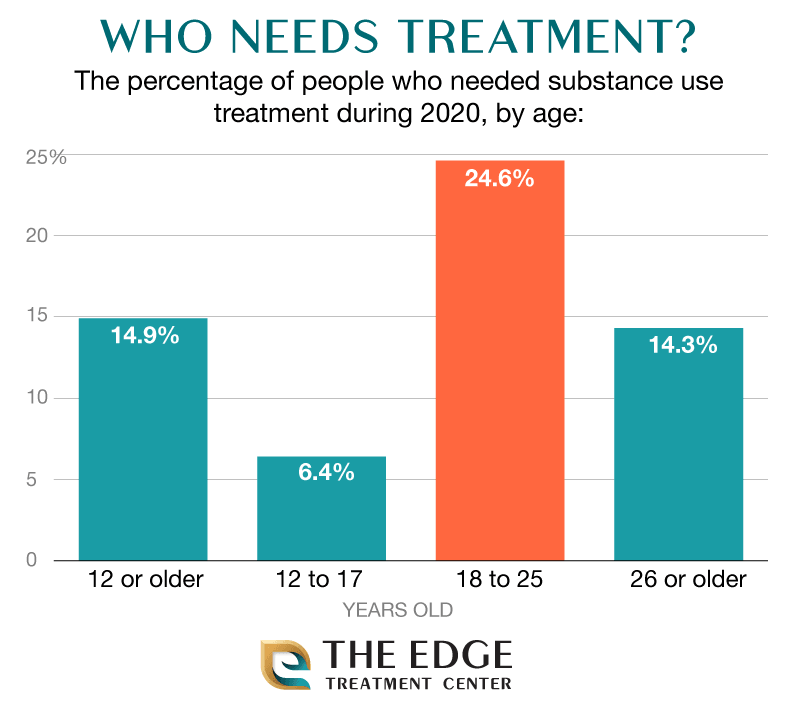
Who Needed Treatment The Most?
According to SAMHSA’s 2020 NSDUH, people aged between 18 and 25 needed drug and alcohol addiction treatment the most in 2020, the most recent year tracked by SAMHSA:
Source: 2020 NSDUH Survey
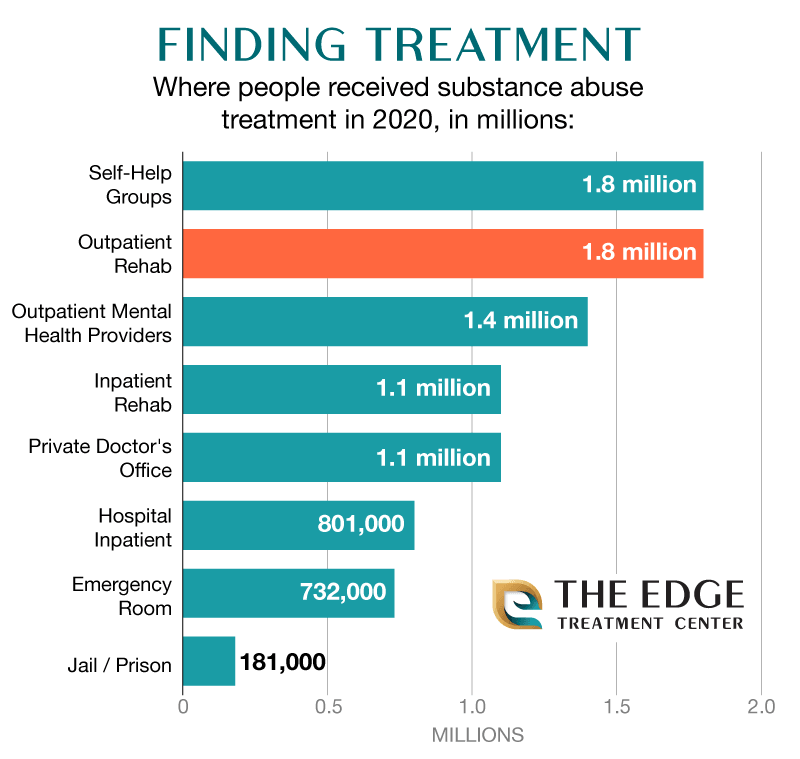
Where People Found Addiction Treatment
1.8 million Americans sought drug and alcohol addiction treatment at outpatient treatment centers like The Edge in 2020, according to SAMHSA’s NSDUH survey:
Source: 2020 NSDUH Survey
COVID-19 AND SUBSTANCE ABUSE
The COVID-19 Effect: How The Pandemic Affected Substance Abuse
Unsurprisingly, the stress, isolation, and fear during the 2020 COVID outbreak changed how people drank. A RAND Corporation study from September 2020 found the consumption of alcohol by adults aged 30 and up rose by 14% … with 41% of women reporting they drank heavily.
Source: Rand Corporation
What Heavy Drinking Looked Like During The COVID-19 Outbreak
USA Today published a study conducted by The Harris Poll and Ireland-based pharmaceutical company Alkermes in mid-2021. Researchers polled just over 6,000 Americans aged 21 and over. Of that community, 1,003 identified themselves as heavy drinkers*.
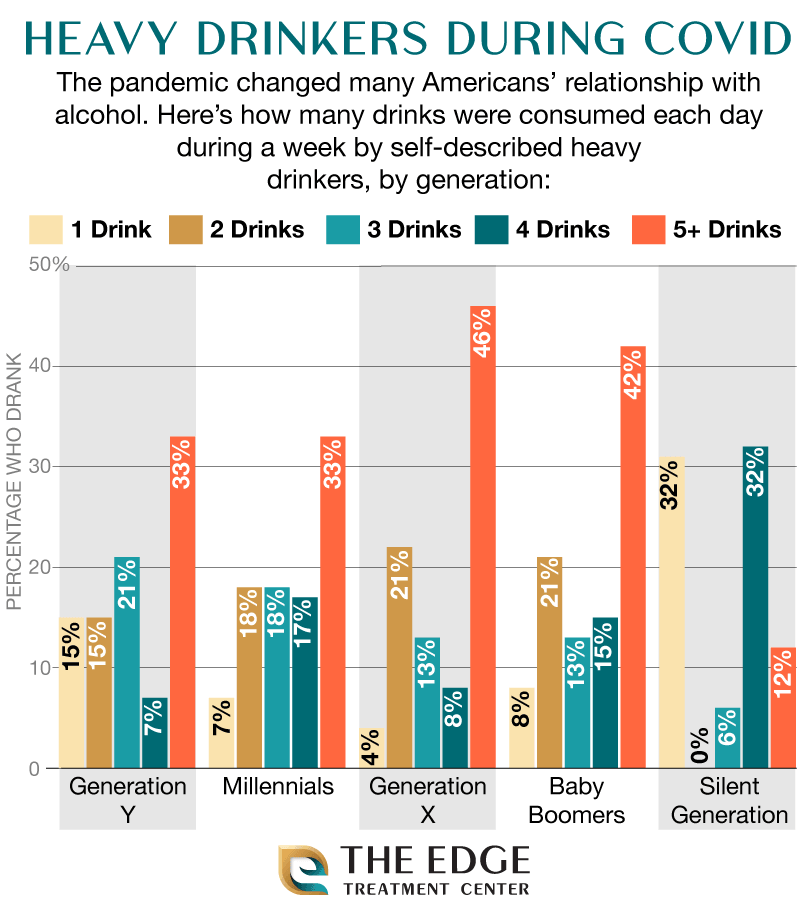
*The survey defined “heavy drinking” as having had two days of heavy drinking during a single week at least twice during the previous month. Heavy drinking itself is defined as having four or more drinks for women and five or more drinks for men in one day.
ECONOMIC ADDICTION STATISTICS
Drug addiction doesn’t just affect individuals and the people around them – it’s a condition that has considerable economic and social costs, too.
The Cost Of Opioid Addiction
According to The Pew Charitable Trusts, each year opioid abuse, opioid addiction, and opioid overdose cost:
$35 billion in healthcare costs
$14.8 billion in criminal justice costs
$92 billion in lost productivity.
Pew also states that improved access to treatment for opioid addiction may save between $25,000 and $105,000 in lifetime costs for each person.
Source: Pew Charitable Trusts
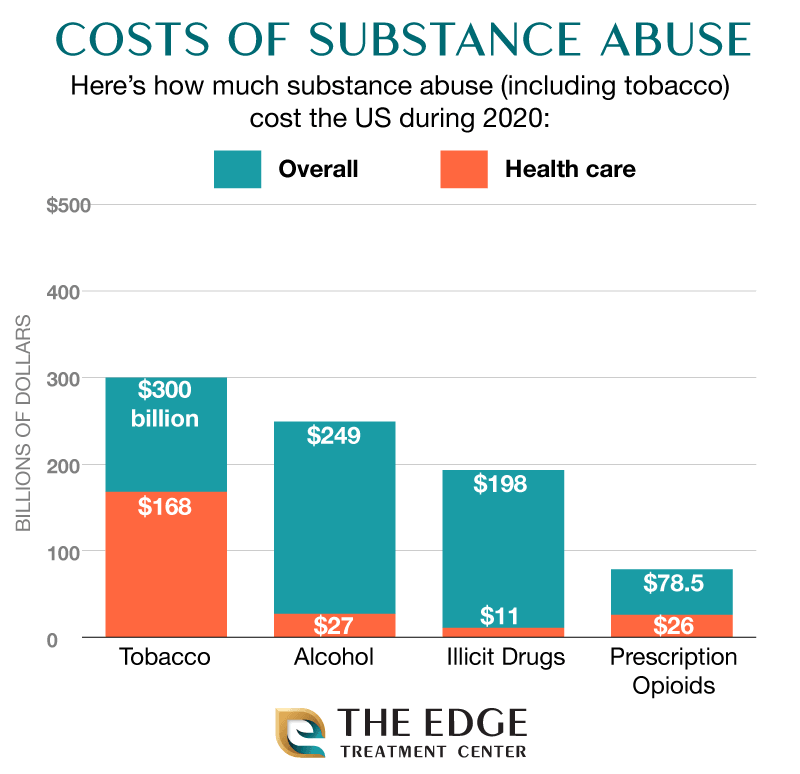
Costs Per Substance: What Substance Abuse Cost The US In 2020
Although a legal substance, tobacco’s addictive … and expensive. In 2020 (the last year with available data), tobacco abuse had the highest cost out of all addictive substances:
Source: Statista.com
Substance Abuse Funding 2012 – 2022
After a short dip near the start of the decade, funding for substance abuse by the National Institutes for Health (NIH) has climbed back up. Current estimates for 2022 substance abuse funding are $2.7 billion:
Source: Statista.com
Funding Support For Substance Use Disorders:
A poll from 2019 shows many Americans support increased funding for opioid addiction research:
Source: Statista
SUBSTANCE ABUSE DEMOGRAPHICS
Alcohol Use
2020 saw a new development in the way people drank – women began to pull ahead of men in alcohol consumption:
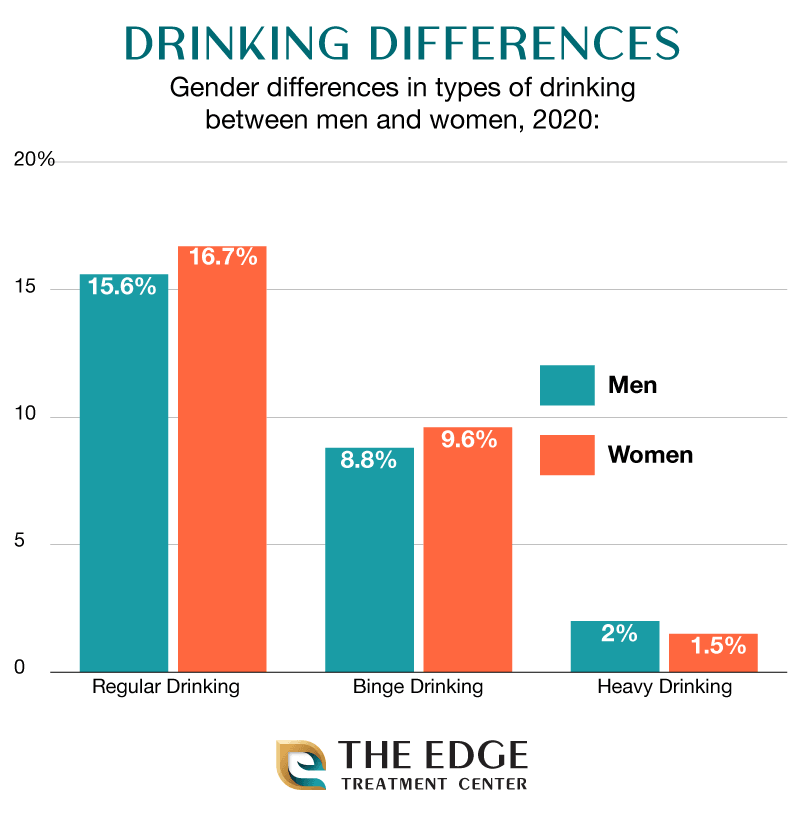
According to the National Institute on Alcohol Abuse and Alcoholism (NIAAA), binge drinking is consuming 4 or more drinks in a two-hour period for women and consuming 5 or more drinks in an hour for men.
As for heavy drinking, NIAAA defines it as more than 4 drinks per day or more than 14 drinks in a week for men and more than 3 drinks per day or more than 7 drinks per week.
Source: Statista.com
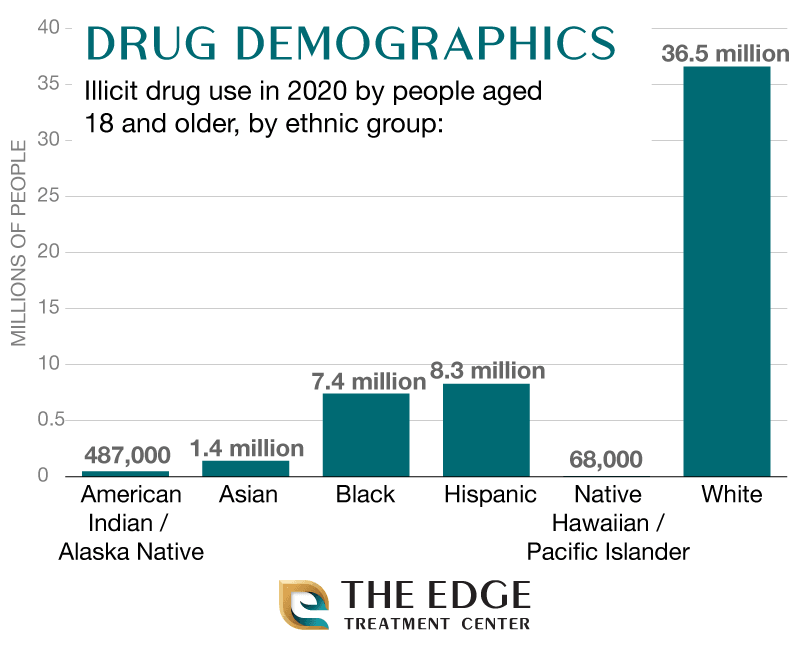
Illicit Drug Use In 2020, By Ethnicity
SAMHSA’s 2020 NSDUH survey measured any illicit drug use during 2020 by ethnic group:
Drug Overdoses, By Ethnicity
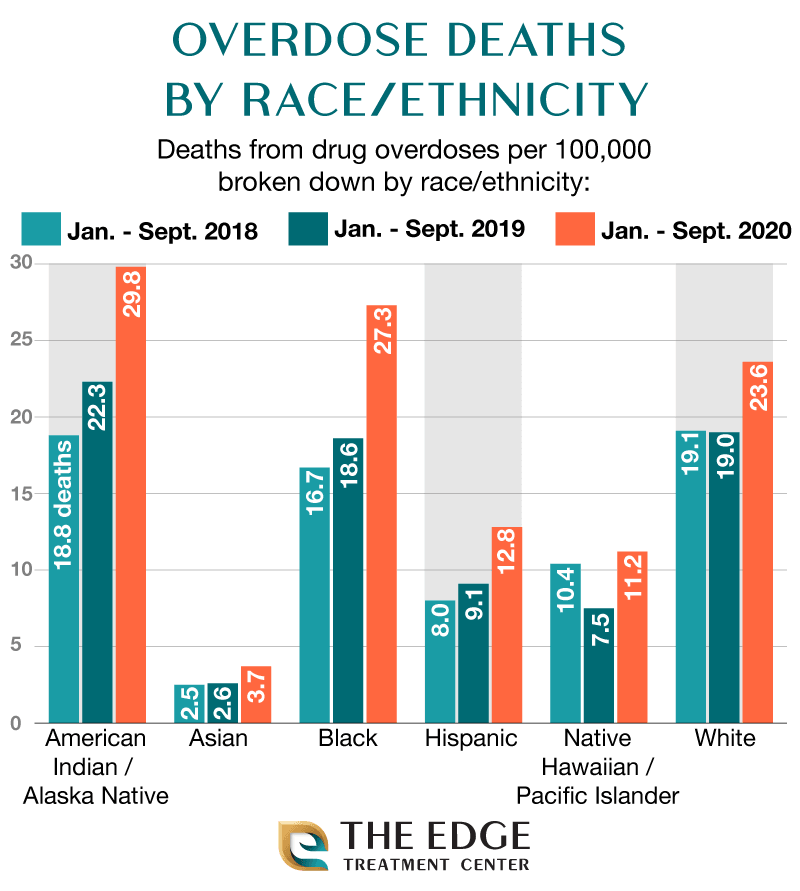
Drug overdose deaths increased in every ethnic group in 2020 … but the largest increases in fatal drug overdoses were seen in communities of color. American Indian / Alaskan Native communities had the highest rate of fatal drug overdoses, according to this chart from the Kaiser Family Foundation:
Source: Kaiser Family Foundation report
LGBTQIA+ Substance Abuse
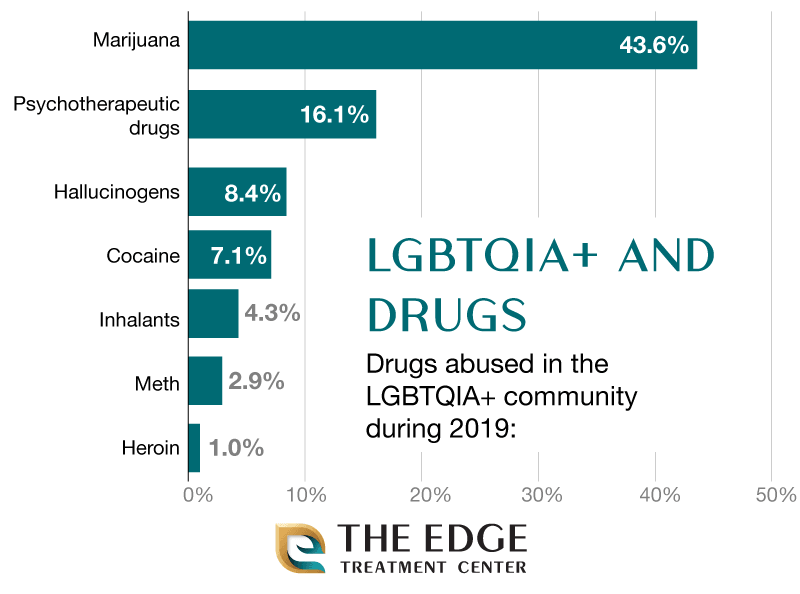
According to the 2019 NSDUH – the most recent data set available – marijuana was the most common illicit drug used by the LGBTQIA+ community:
Source: SAMHSA
The Edge Treatment Center is host to a thriving LGBTQIA+ community.
Overcoming Barriers
The stigma of addiction and co-occurring mental disorders is often cited as being the largest barrier to drug treatment. Put simply, stigma blames people struggling with drug and alcohol addiction for their own problems, viewing the condition as a sign of bad character or poor morals.
Stigma often prevents people from receiving drug and alcohol treatment, either due to the actions of healthcare providers or internalized guilt. Overcoming stigma is a challenge faced by patients, their families, and caregivers.
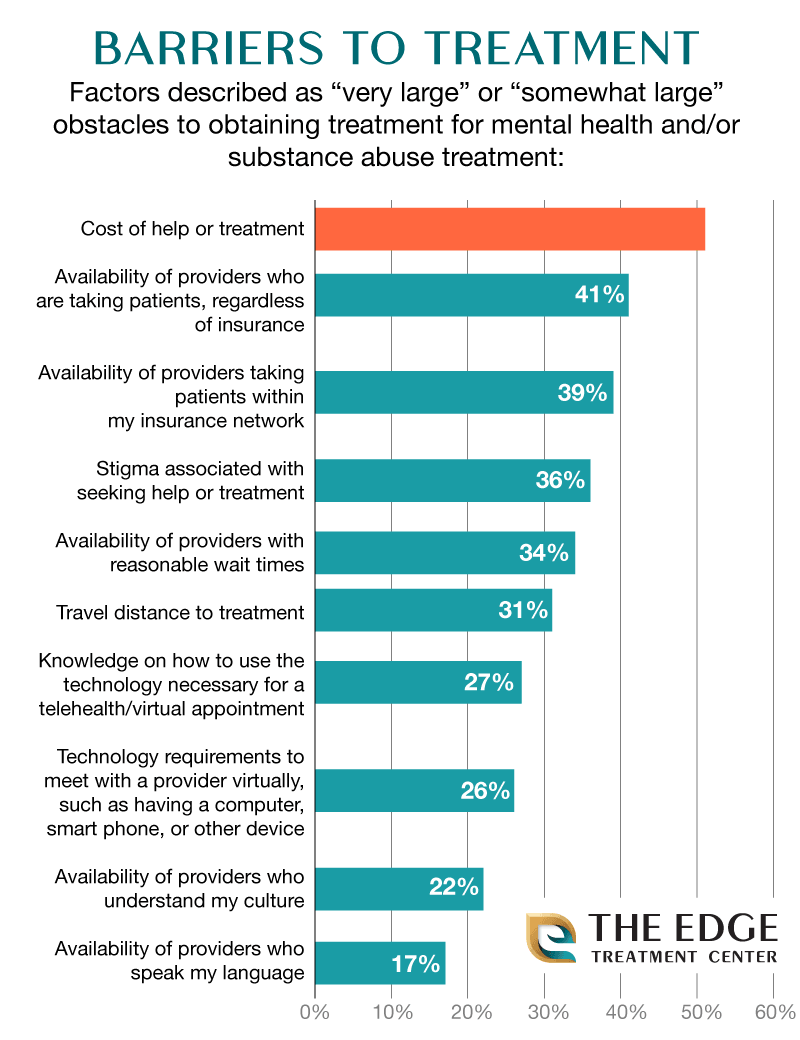
However, a 2021 poll about drug & alcohol addiction treatment conducted by the Bipartisan Policy Center and Morning Consult found while stigma was still a considerable barrier to treatment, the costs and insurance of drug and alcohol addiction acted as far larger barriers to getting addiction treatment in the US:
Source: Bipartisan Policy Center
A Reason To Hope
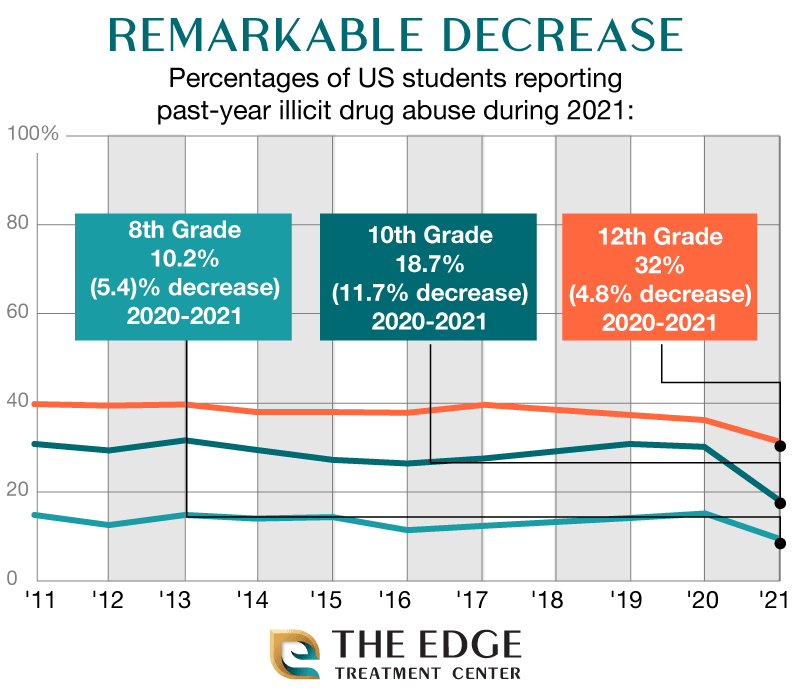
The National Institute on Drug Abuse’s (NIDA) 2021l Monitoring The Future study found fewer adolescents reported substance abuse in 2021, defying other substance abuse trends during the COVID-19 outbreak.
Source: NIDA
Don’t Be A Statistic
The dangers of drug and alcohol addiction are many: overdoses, falls, and for abusers of illicit drugs, there’s a serious risk of assault and even murder when purchasing drugs.
It doesn’t have to be that way, however. The Edge Treatment Center offers something unique: a community-focused experience aimed at teaching people how to find joy and meaning in life without drug and alcohol abuse.
A happier life can start today – contact an Edge expert now!

We’re Here To Help You Find Your Way
If you or a loved one is struggling with addiction, there is hope. Our team can guide you on your journey to recovery. Call us today.
Written by
 Brian Moore
Content Writer
Reviewed by
 Jeremy Arzt
Chief Clinical Officer
Trends and Statistics
Drug and Alcohol
August 27, 2021
